Difference between revisions of "SMT201 AY2019-20T1 EX2 Lim Jia Khee"
Jump to navigation
Jump to search


| Line 1: | Line 1: | ||
| − | == Part 1: | + | == Part 1: Data visualisation of vector layers == |
</br> | </br> | ||
[[File:Map Layout 1.png|1000px|border|center]] | [[File:Map Layout 1.png|1000px|border|center]] | ||
Revision as of 23:24, 9 November 2019
Contents
- 1 Part 1: Data visualisation of vector layers
- 2 Part 2: Proximity Analysis, Raster Layers
- 3 Part 3: Standardisation of Proximity Analysis, Min-Max technique
- 4 Part 4: Analytical Hierarchical Process (AHP) input matrix and result report
- 5 Part 5: Suitable landlot(s) identified
- 6 References and data sources
Part 1: Data visualisation of vector layers

| Data | Source | Data Description | Source URL | Data Type |
|---|---|---|---|---|
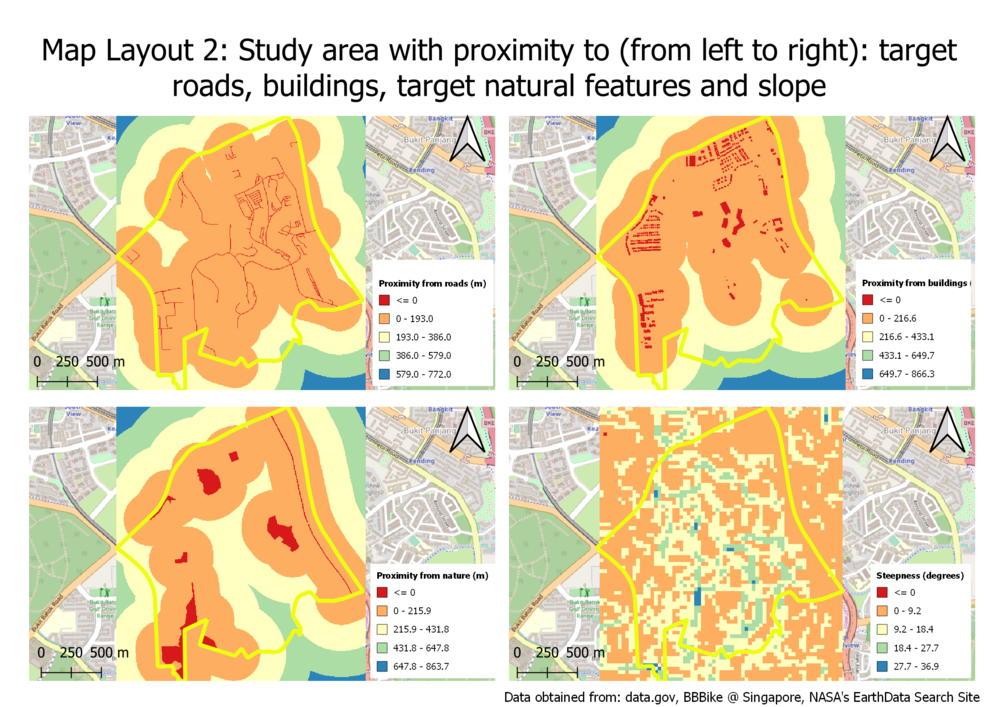
Part 2: Proximity Analysis, Raster Layers

| Data | Source | Data Description | Source URL | Data Type |
|---|---|---|---|---|
Part 3: Standardisation of Proximity Analysis, Min-Max technique

| Data | Source | Data Description | Source URL | Data Type |
|---|---|---|---|---|
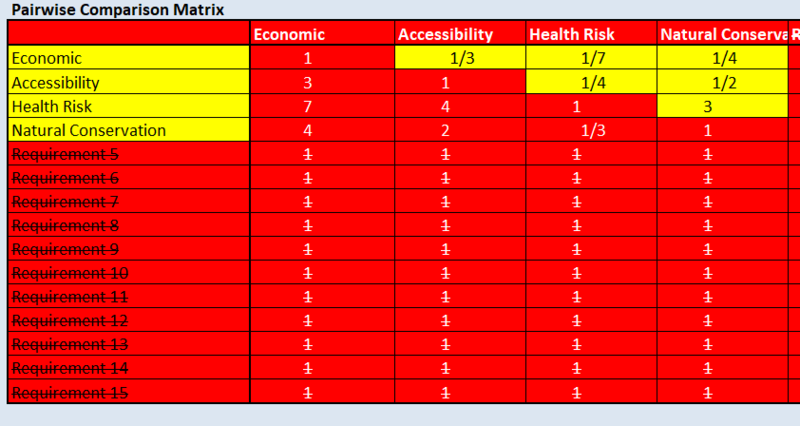
Part 4: Analytical Hierarchical Process (AHP) input matrix and result report
 |
 |
| Data | Source | Data Description | Source URL | Data Type |
|---|---|---|---|---|
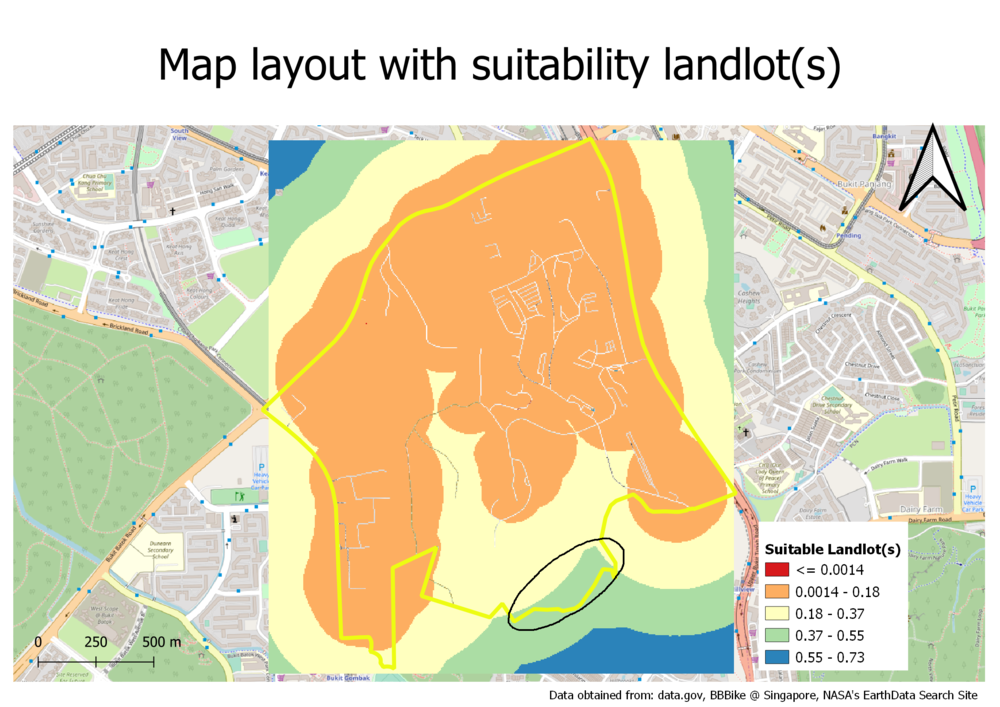
Part 5: Suitable landlot(s) identified

| Data | Source | Data Description | Source URL | Data Type |
|---|---|---|---|---|