Difference between revisions of "SMT201 AY2019-20G1 EX2 Kok Su Yee"
| Line 39: | Line 39: | ||
==Part 3: Map layout with four views showing the criterion scores of each factor layers== | ==Part 3: Map layout with four views showing the criterion scores of each factor layers== | ||
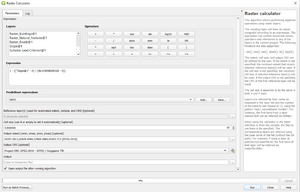
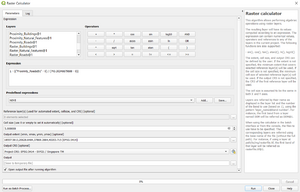
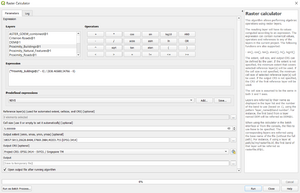
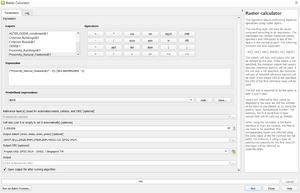
| + | The scale of measurement of the different factors layers proximity are currently different. Therefore, I uses the method of Min-Max criteria standardization techniques (𝑴𝑴(𝒙𝒊𝒋)=𝒙𝒊𝒋−𝒙𝒎𝒊𝒏𝒙𝒎𝒂𝒙−𝒙𝒎𝒊𝒏) to standardise all the factors and the criterion scores are calculated with the application of Raster Calculator in QGIS: | ||
* Economic factor | * Economic factor | ||
| + | [[File:Criterion Road (Su Yee).png|300px]] | ||
* Accessibility factor | * Accessibility factor | ||
| + | [[File:Criterion Buildings (Su Yee).png|300px]] | ||
* Health risk factor | * Health risk factor | ||
| + | [[File:Criterion Natural (Su Yee).png|300px]] | ||
* Natural conservation factor | * Natural conservation factor | ||
| + | [[File:Criterion Slope (Su Yee).png|300px]] | ||
| + | After setting up the various criterion scores, the map layout displaying the four views of these criterion scores is created: | ||
| + | |||
==Part 4: Analytical Hierarchical Process Input Matrix and Result Report == | ==Part 4: Analytical Hierarchical Process Input Matrix and Result Report == | ||
==Part 5: Map layout with the Suitability Land Lot(s) == | ==Part 5: Map layout with the Suitability Land Lot(s) == | ||
Revision as of 16:33, 8 November 2019
Contents
- 1 Part 1: Gombak Study Area Map layout with four views
- 2 Part 2: Proximity Map layout with four views
- 3 Part 3: Map layout with four views showing the criterion scores of each factor layers
- 4 Part 4: Analytical Hierarchical Process Input Matrix and Result Report
- 5 Part 5: Map layout with the Suitability Land Lot(s)
- 6 References
Part 1: Gombak Study Area Map layout with four views
In order to determine whether the location is suitable to build a national Communicable Disease Quarantine Centre, there are a few critical decision factors to take into consideration: Economic, Accessibility, Health Risk and Natural Conservation. Since the selected site is at Gombak Planning Subzone, the following is the map layout that consists of views in relation to the decision factors.

Accessibility Factor: Gombak Study area and the target roads
The target road types are service roads and tracks and the selected site has to be close to the existing local roads. Looking at the first view of the map, we can see that there is high accessibility of service road lines in the North and East side of the Gombak Subzone whereas the other parts of the Gombak does not have local roads to access. To ensure that there is no difficulty in transporting the building materials during the construction stage, the quarantine centre can be built in North eastern area of Gombak.
Health Risk Factor: Gombak Study area and buildings
Health risk factor plays a part when selecting the right location to build the quarantine centre so that it is at far proximity from the buildings that are populated with people. Considering this critical factor, it would be appropriate to build the quarantine centre at the Southern side of Gombak as there is no presence of buildings. The overall presence of the buildings is widely spread out at the Northen and Western part of Gombak so there are other available lands for us to select from.
Natural Conservation Factor: Gombak Study area and the target natural features
From this map view, it is apparent that there is not many natural features, namely forested land, park and water in Gombak Subzone. The natural conservation factor will not contribute a lot to selecting the suitable site. The natural feature types are represented by their own nature colours, green and blue in the map. In this case, there are available land at the Southern and Eastern areas of Gombak where there is no sight of natural features and it will be appropriate to construct the quarantine centre there.
Economic Factor: Gombak Study area and digital elevation
The selected site has to meet the economic factor where there is no steep slope in the vicinity and this to avoid incurring high development cost due to cut-and-fill activities. In this map view of digital elevation raster map, the highest value of elevation is 143 metres above the sea level. The highly elevated area is situated around Southern side of Gombak Subzone where it is coloured in white in that part and this area is suitable for building the quarantine centre.
Part 2: Proximity Map layout with four views
Proximity analysis is essential for us to define the best site location, it measures the distance between study area to the different factors layers. As a result, proximity maps are created to display the relations of the study area, Gombak Subzone in proximity with the different factors layers.

Accessibility Factor: Study area and proximity to target roads layer
With the rasterised road layer to shows the proximity of the targets road to Gombak, it is clear that the minimum and maximum distance from the road are 0 and 743.303 metres respectively.
Health Risk Factor: Study area and proximity to buildings layer
With the rasterised road layer to shows the proximity of the buildings to Gombak, it is clear that the minimum and maximum distance from the road are 0 and 838.446 metres respectively.
Natural Conservation Factor: Study area and proximity to target natural features layers
With the rasterised road layer to shows the proximity of the target natural features to Gombak, it is clear that the minimum and maximum distance from the road are 0 and 863.669 metres respectively.
Economic Factor: Study area and slope layer
The lowest degree for the slope layer is 0 and the highest degree is 36.419 degrees. The grids that has a darker grey intensity displays the locations with relatively gentle slope. Locations with steeper slope are indicated with lighter grey grids.
Part 3: Map layout with four views showing the criterion scores of each factor layers
The scale of measurement of the different factors layers proximity are currently different. Therefore, I uses the method of Min-Max criteria standardization techniques (𝑴𝑴(𝒙𝒊𝒋)=𝒙𝒊𝒋−𝒙𝒎𝒊𝒏𝒙𝒎𝒂𝒙−𝒙𝒎𝒊𝒏) to standardise all the factors and the criterion scores are calculated with the application of Raster Calculator in QGIS:
- Economic factor
- Accessibility factor
- Health risk factor
- Natural conservation factor
 After setting up the various criterion scores, the map layout displaying the four views of these criterion scores is created:
Part 4: Analytical Hierarchical Process Input Matrix and Result Report
Part 5: Map layout with the Suitability Land Lot(s)
References
- Data Gov Master Plan 2014 Subzone Boundary " Master Plan 2014 Subzone Boundary"
- OpenStreetMap (OSM) Data sets " OpenStreetMap (OSM) Data sets"
- ASTER Global Digital Elevation Model (GDEM) Dataset "ASTER Global Digital Elevation Model (GDEM) Dataset"


