Difference between revisions of "SMT201 AY2019-20G1 Ex1 Kang Hui Yun"
Jump to navigation
Jump to search
| Line 2: | Line 2: | ||
=== Public Schools === | === Public Schools === | ||
| + | |||
| + | [[File:Public Schools.png|border|550px|center]] | ||
| + | |||
| + | |||
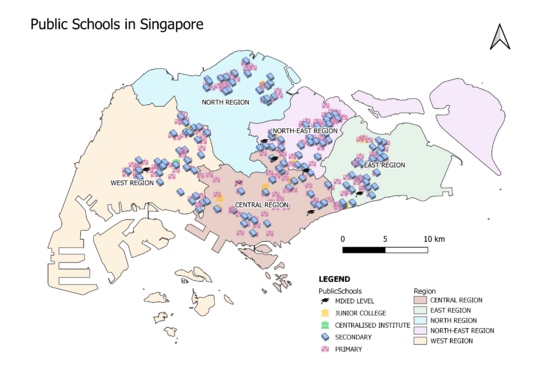
| + | The map above shows the distribution of public education institutions, classified into distinct school levels—mixed level, junior colleges, centralised institutes, secondary and primary. Considering the overall presentation, the coastal map outline is given a light (green) colour for better visualisation. As there are many features (i.e. public schools) and classes (i.e. school levels), the visual variables gets cluttered when viewing the whole map. Hence, a different colour and SVG is used to represent each school type so as to help map readers distinguish among the clusters easily. | ||
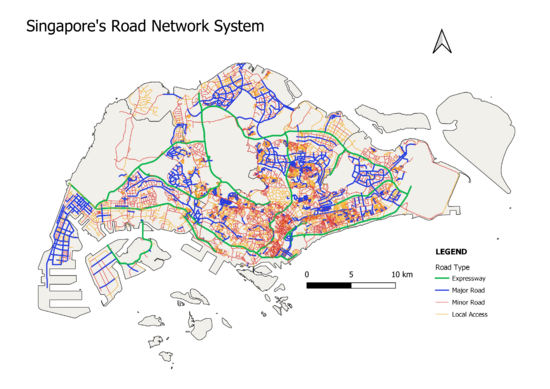
=== Road Network System === | === Road Network System === | ||
| + | |||
| + | [[File:Road Network System Kang Hui Yun.png|border|550px|center]] | ||
=== 2014 Master Plan Land Use === | === 2014 Master Plan Land Use === | ||
== Part 2: Choropleth Mapping == | == Part 2: Choropleth Mapping == | ||
Revision as of 00:48, 14 September 2019
Contents
Part 1: Thematic Mapping
Public Schools

The map above shows the distribution of public education institutions, classified into distinct school levels—mixed level, junior colleges, centralised institutes, secondary and primary. Considering the overall presentation, the coastal map outline is given a light (green) colour for better visualisation. As there are many features (i.e. public schools) and classes (i.e. school levels), the visual variables gets cluttered when viewing the whole map. Hence, a different colour and SVG is used to represent each school type so as to help map readers distinguish among the clusters easily.
Road Network System
