Difference between revisions of "G1-Group06 Report"
| Line 47: | Line 47: | ||
====Planning area ==== | ====Planning area ==== | ||
| + | -------------------------------------------------------------------------------------------------------------------------------------- | ||
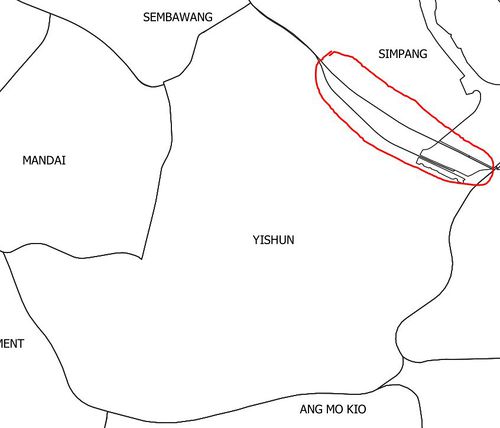
[[File:Paa0814.jpg|500px|thumb|center| 2008 & 2014 Planning Area]] | [[File:Paa0814.jpg|500px|thumb|center| 2008 & 2014 Planning Area]] | ||
{| style="margin:left; padding: 5px 10px 5px 10px" width="100%" | {| style="margin:left; padding: 5px 10px 5px 10px" width="100%" | ||
| Line 57: | Line 58: | ||
|} | |} | ||
| − | + | ||
==== Land Use ==== | ==== Land Use ==== | ||
-------------------------------------------------------------------------------------------------------------------------------------- | -------------------------------------------------------------------------------------------------------------------------------------- | ||
Revision as of 21:18, 23 October 2019
|
|
|
|
|
|
Yishun's Brief Overview
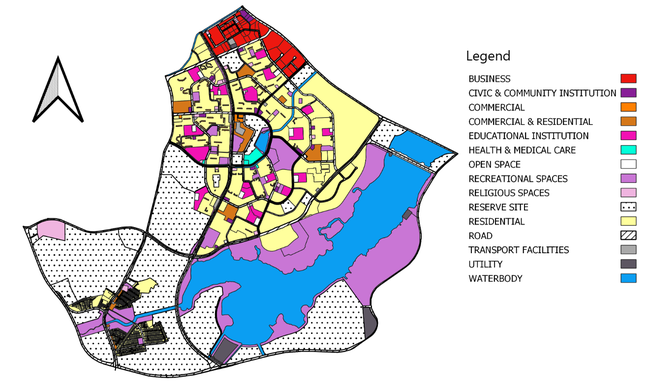
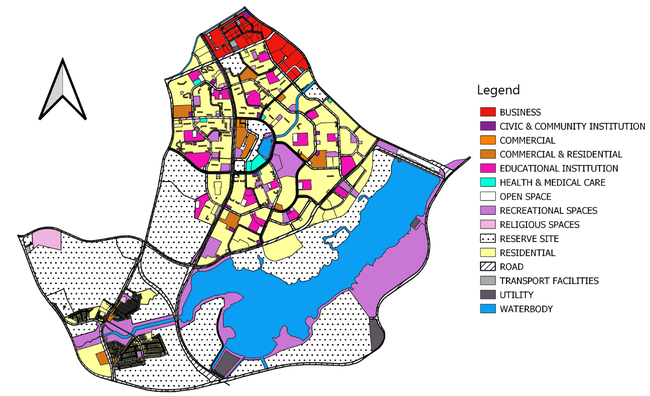
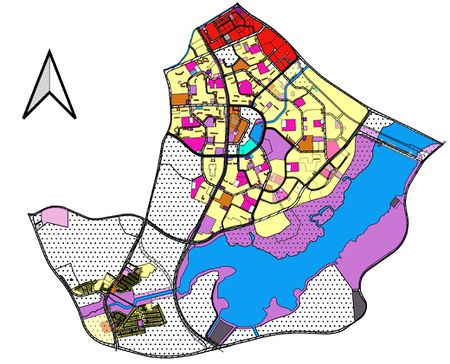
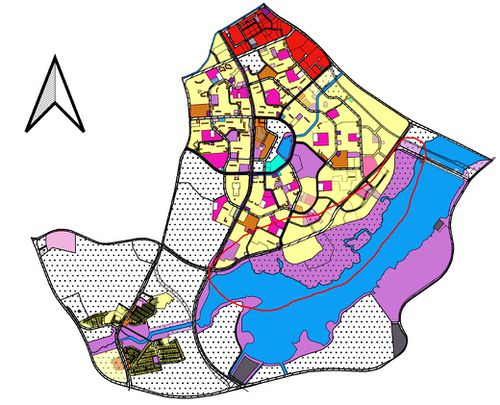
2008 & 2014 LandUse
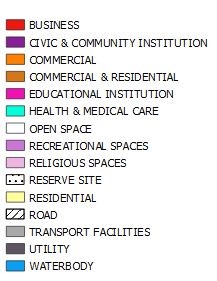
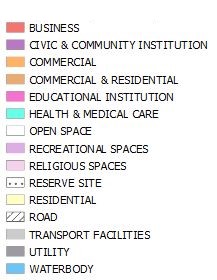
| For the legend, Our group had decided to combine some of the features as it is under the same categories. Furthermore, by minimizing the legend would make it more meaningful and easy to understand. |
Change Detection
Macro Changes (Overview)
Planning area
| The planning area of Yishun has reduced in 2014 from 2008. As seen in both of the maps in the table above, the planning area of Yishun has reduced inwards and given to Simpang. |
Land Use
| 2008 Overlay Legend | 2014 Overlay Legend |
| Facilities | No. of Attributes 2008 | Land area use 2008 (m2) | No. of Attributes 2014 (m2) | Land area use 2014 | Change in No. of Attributes from 2008-2014 | Change in Land area use from 2008-2014 (m2) |
|---|---|---|---|---|---|---|
| BUSINESS | 45 | 530,097.2827 | 51 | 535,522.6 | +6 | +5,425.3173 |
| CIVIC & COMMUNITY INSTITUTION | 20 | 83,109.91 | 15 | 56,774.33 | -5 | -26,335.58 |
| COMMERCIAL | 6 | 17,206.42 | 7 | 22,488.49 | +1 | +5,282.07 |
| COMMERCIAL & RESIDENTIAL | 125 | 379,926.4 | 130 | 438,770.4 | +5 | +58,844 |
| EDUCATION INSTITUTION | 19 | 473,926.5 | 22 | 534,748.4 | +3 | +60,821.9 |
| HEALTH & MEDICAL CARE | 4 | 48,635.33 | 7 | 66,792.15 | +3 | +18,156.82 |
| OPEN SPACE | 15 | 101,455.2 | 17 | 102,034.5 | +2 | +579.3 |
| RECREATIONAL SPACES | 49 | 3,003,726 | 62 | 2,066,471 | +13 | -937,255 |
| RELIGIOUS SPACES | 22 | 173,704.5 | 22 | 171,076.4 | 0 | -2,628.1 |
| RESERVE SITE | 28 | 6,086,257 | 26 | 6,559,978 | -2 | +473,721 |
| RESIDENTIAL | 1131 | 4,744,240 | 1212 | 4,467,612 | +81 | -276,628 |
| ROAD | 146 | 1,995,624 | 154 | 2,170,654 | +8 | +175,030 |
| TRANSPORT FACILITIES | 12 | 56,899.52 | 12 | 42,612.63 | 0 | -14,286.89 |
| UTILITY | 10 | 178,745 | 13 | 184,546.9 | +3 | +5,801.9 |
| WATERBODY | 26 | 3,705,319 | 31 | 3,446,420 | +5 | -258,899 |
| From the summary above, we can generally observe that despite the reduction of planning area as mentioned above, there is a significant increase in land use for residential (increase by 81 attributes) and recreational (increase by 13 attributes) spaces that occurred from 2008 to 2014. A slight increase of about 2-5 attributes have been observed for the other facilities such as Educational Institutions and Water Bodies that are available in Yishun. Transport Facilities and Religious Spaces are exceptions being the only two facilities that had no changes in the number of attributes. There was only a decrease in land use for Civic and Community Institution where a reduction of 5 attributes for the facility was observed. |
Micro Changes (Attributes)
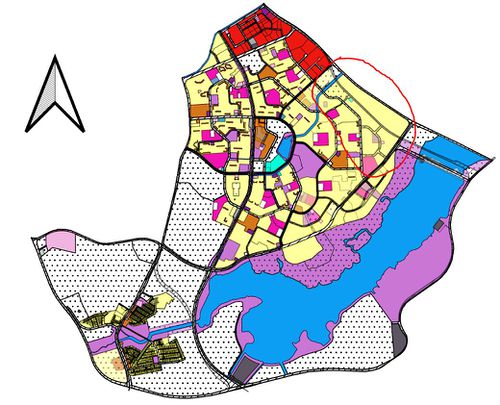
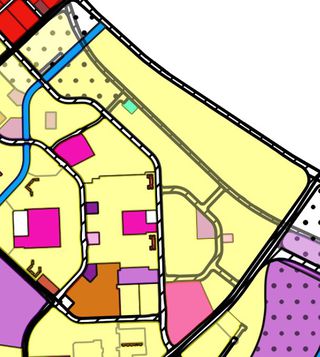
| 1.North-East Land Area changed from residential land to Education Institutions, Roads and Health, and Medical Care, Place of Worship, Park. |
| Zoom In version |
|---|
| 2008 LandUse | 2014 LandUse | Legend |
|---|
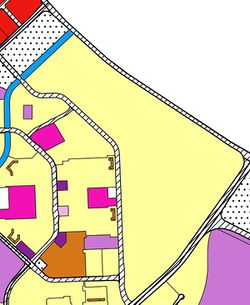
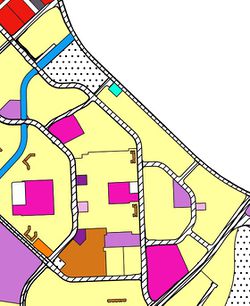
| In North-Eastern Yishun, apart from the reduction of land area as mentioned in the previous sections, a large area that was proportioned out for residential use in 2008 was further proportioned into smaller areas in 2014. In 2014, additional features such as an Educational Institution, Health & Medical Care, Religious Spaces, Parks and Roads were added into the area that was proportioned for residential use in 2008. |
______________________________________________________________________________________________________________________________________
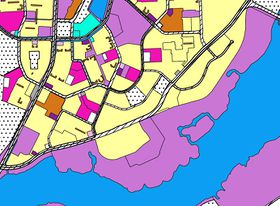
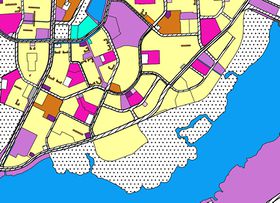
| 2.Southern Yishun (near the large waterbody) changed from Sports and Recreation to Reserve Site. |
| Zoom In version |
|---|
| 2008 LandUse | 2014 LandUse | Legend |
|---|
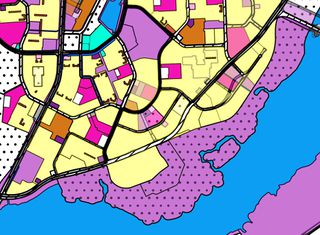
| In 2008, a large area in the South of Yishun near the large area of Waterbody was proportioned for Recreational Spaces use. However, in 2014 the large area was changed to be used as a Reserve Site. Additionally, the land area further away from the banks of the Waterbody, above the area proportioned for Recreational Space, was largely proportioned for Residential use in 2008. However in 2014, new features like Educational Institutions, Recreational Space and Businesses were added to the area proportioned for Residential use. |
______________________________________________________________________________________________________________________________________
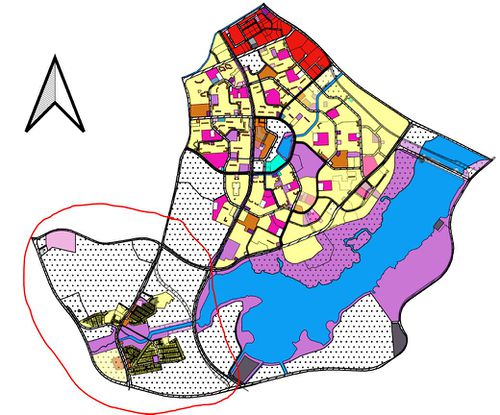
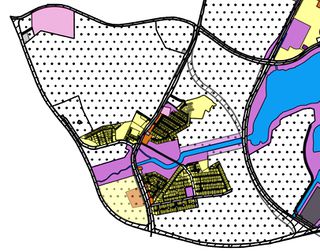
| 3.South-Western Yishun (large area of reserve sites and special use site) were converted to transport facilities, roads, residential and commercial and residential areas. Existing parks were expanded. |
| Zoom In version |
|---|
| 2008 LandUse | 2014 LandUse | Legend |
|---|
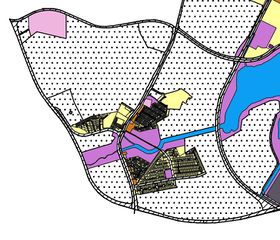
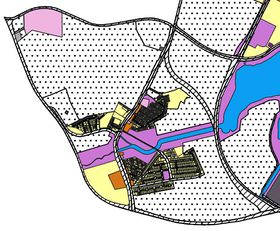
| In 2008, South-Western Yishun was mostly made up of large areas of Reserves Sites and Recreational Spaces that surrounded densely subdivided residential areas. In 2014, small areas of the Reserve Sites were subdivided and converted into areas used for Transport Facilities, Recreational Spaces, and Commercial & Residential use. A small area of Reserve Site was also converted for Utility use and a major road was constructed that connects the Utility to the waterbody that runs through South-Western Yishun. |
______________________________________________________________________________________________________________________________________

