Difference between revisions of "SMT201 AY2019-20T1 EX1 Gui yuqi"
| Line 16: | Line 16: | ||
== 2014 Master Plan Landuse == | == 2014 Master Plan Landuse == | ||
<br> | <br> | ||
| − | [[File:1. | + | [[File:1.3R.jpg|3000px|frameless|center|ise]] |
Source: data.gov.sg<br> | Source: data.gov.sg<br> | ||
<br> | <br> | ||
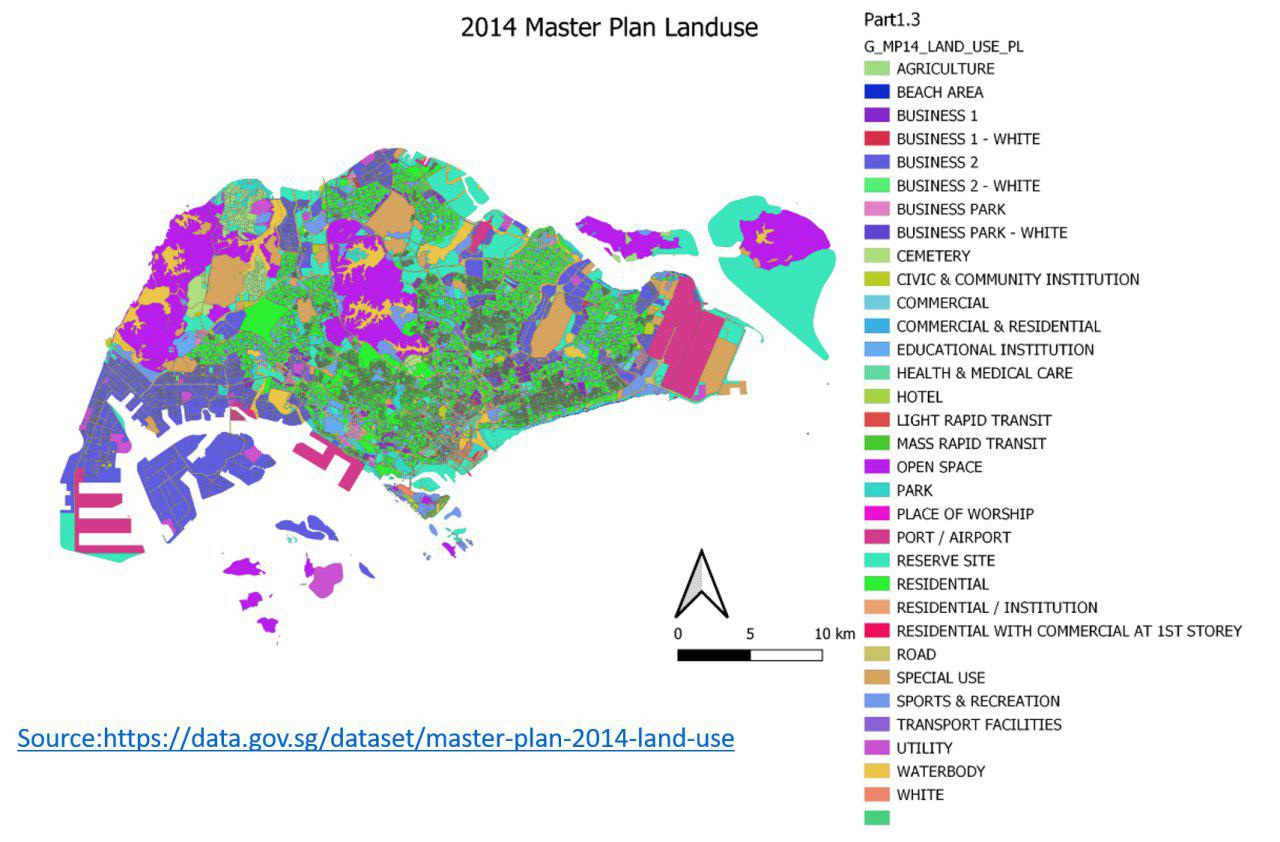
For a better and clearer visualization of 2014 Master Plan Landuse, I used categorized Symbology and distinct colors to represent different categories of land use, so that different land use area can be easily distinguished. In addition, since there are a lot of different landuse categories, I reduces stroke width so that each area can be clearly visualized.<br> | For a better and clearer visualization of 2014 Master Plan Landuse, I used categorized Symbology and distinct colors to represent different categories of land use, so that different land use area can be easily distinguished. In addition, since there are a lot of different landuse categories, I reduces stroke width so that each area can be clearly visualized.<br> | ||
<br> | <br> | ||
| + | |||
= Part 2 = | = Part 2 = | ||
<br> | <br> | ||
Revision as of 22:51, 15 September 2019
Contents
Part 1
Singapore Public School Distribution by School Type
Source: Data.gov.sg
I used School-directory-and-information data from Data.gov and MP14_PLNG_AREA_NO_SEA_PL to achieve this task. I geocoded the school information data into the planning area data so that each school's location can be showed on the map. In order to show the number of school distribution on the map, I added new column called School_Num to calculation the school number for each Planning area.
Hierarchy of Road Network System of Singapore
Source: Data.gov.sg & LTA
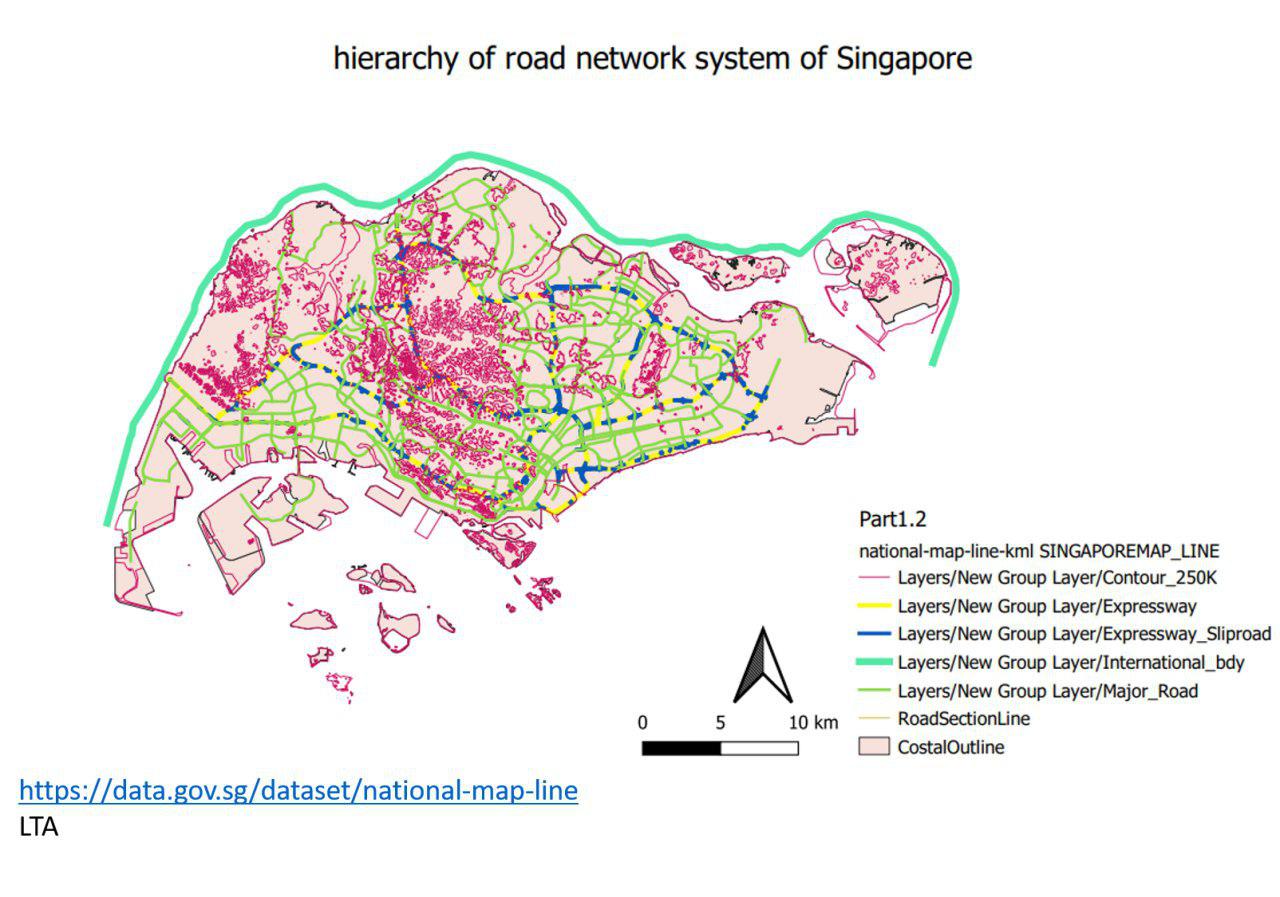
In order to display the hierarchy of road network system of Singapore, I found a data called National-map-line from Data.dov which includes a column called "FOLDERPATH", and this column indicates the category of this road. There are 5 types of roads, range from Contour, Expressway, Expressway Slip road to International boundary and Major Road. In order to display the road hierarchy clearer on the map, I applied different stroke size and different color for each type of roads.
2014 Master Plan Landuse
Source: data.gov.sg
For a better and clearer visualization of 2014 Master Plan Landuse, I used categorized Symbology and distinct colors to represent different categories of land use, so that different land use area can be easily distinguished. In addition, since there are a lot of different landuse categories, I reduces stroke width so that each area can be clearly visualized.
Part 2


