Difference between revisions of "SMT201 AY2019-20G2 Ex1 Ng Qi Hui"
Jump to navigation
Jump to search
(Created page with "border|center|800x800px|") |
|||
| Line 1: | Line 1: | ||
[[File:Distribution_of_School_Types.png |border|center|800x800px|]] | [[File:Distribution_of_School_Types.png |border|center|800x800px|]] | ||
| + | |||
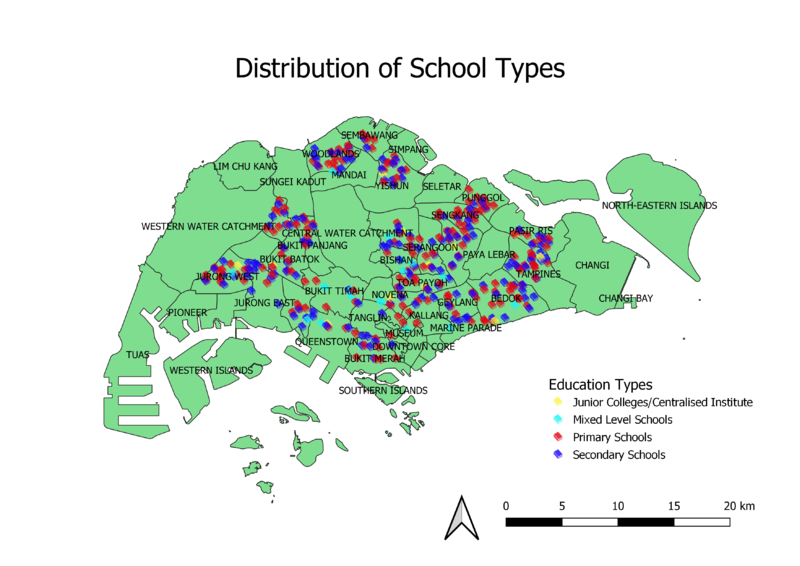
| + | The school types are qualitative data with nominal scales, so I categorized the data in POI_CHAR from the attribute table. I made use of the SVG symbols to symbolize schools. Following that, by assigning a different color to every school type, I could show the distribution of the type of schools throughout Singapore. For better identification purposes, I added the planning area of Singapore and included their labels so that the user can know at a glance where are the different types of schools located at. | ||
Revision as of 22:45, 15 September 2019

The school types are qualitative data with nominal scales, so I categorized the data in POI_CHAR from the attribute table. I made use of the SVG symbols to symbolize schools. Following that, by assigning a different color to every school type, I could show the distribution of the type of schools throughout Singapore. For better identification purposes, I added the planning area of Singapore and included their labels so that the user can know at a glance where are the different types of schools located at.