Difference between revisions of "SMT201 AY2019-20G2 Ex1 Jerome Quah Wei Ren"
| Line 24: | Line 24: | ||
==== Description ==== | ==== Description ==== | ||
| − | The areas were | + | The areas were narrowed down to the following which I feel are relevant in this map. The OpenStreetMap layer was also added for the map viewer to easily identify these areas. |
With the land scarcity of Singapore, this map was designed to emphasise the open spaces of Singapore that could be utilised for further developments. The special/reserved areas designate the areas which are unavailable to be utilised. With Singapore being a major transhipment hub relying on exports from foreign countries, waterbodies and agriculture are also highlighted in this map where these areas could be substituted for other purposes. | With the land scarcity of Singapore, this map was designed to emphasise the open spaces of Singapore that could be utilised for further developments. The special/reserved areas designate the areas which are unavailable to be utilised. With Singapore being a major transhipment hub relying on exports from foreign countries, waterbodies and agriculture are also highlighted in this map where these areas could be substituted for other purposes. | ||
Revision as of 16:19, 15 September 2019
Contents
- 1 PART I: Thematic Mapping
- 2 PART II: Choropleth Mapping
- 2.1 Map 4: Aged Population (+65) in Singapore in 2010
- 2.2 Map 5: Aged Population (+65) in Singapore in 2018
- 2.3 Map 6: Proportion of Aged Population (+65) in Singapore in 2010
- 2.4 Map 7: Proportion of Aged Population (+65) in Singapore in 2018
- 2.5 Map 8: Percentage Change of Aged Population (+65) in Singapore between 2010 and 2018
PART I: Thematic Mapping
Map 1: Distribution of Public Education Institutions in Singapore
Description
For this map, the data points were further classified and designed according to their type or main level, namely Centralised Institute, Mixed Level School, Junior College, Secondary School and Primary School, allowing the map viewer to differentiate the different public education institutions around Singapore.
The 2014 Planning Subzone Regions were also used to signify the regions of Singapore, allowing the viewer to further view these institutions in their appropriate regions. The OpenStreetMap layer was inserted to further pinpoint the location of the institutions in terms of different transport modes that can be taken to reach them, nearby amenities etc.
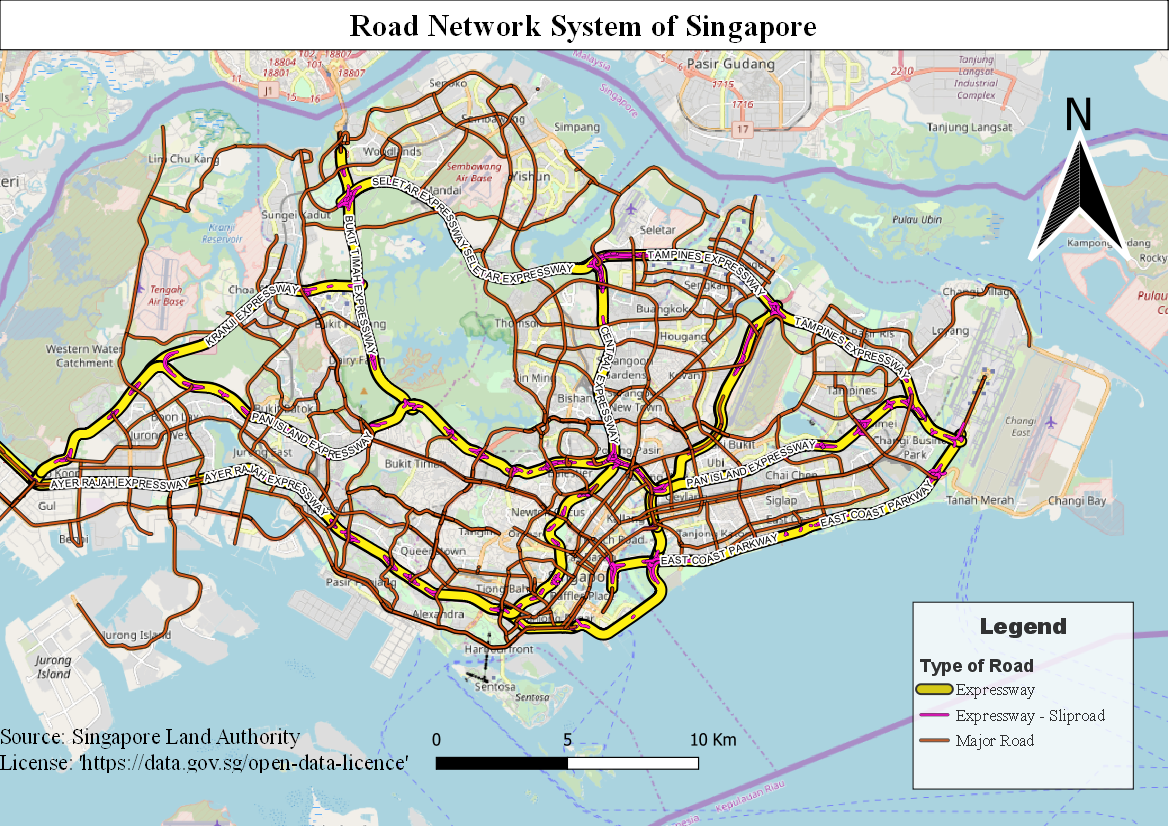
Map 2: Road Network System of Singapore
Description
The data points were further classified and designed according to their type and symbol description, namely Expressway, Expressway-Sliproad and Major Roads. Contour lines were removed due to its inapplicability and the international boundary was replaced using the OpenStreetMap layer that also represents this. The expressways were labelled accordingly to their name, allowing the map viewer to view these expressways at a glance.
With the function of Rule-based labelling, the major roads were also labelled accordingly with a minimum scale of 1:100000, allowing the viewer to zoom in and identify these roads which can be connected to the expressways via sliproads.
Map 3: 2014 Master Plan Landuse
Description
The areas were narrowed down to the following which I feel are relevant in this map. The OpenStreetMap layer was also added for the map viewer to easily identify these areas.
With the land scarcity of Singapore, this map was designed to emphasise the open spaces of Singapore that could be utilised for further developments. The special/reserved areas designate the areas which are unavailable to be utilised. With Singapore being a major transhipment hub relying on exports from foreign countries, waterbodies and agriculture are also highlighted in this map where these areas could be substituted for other purposes.


