Difference between revisions of "Analysis"
| Line 125: | Line 125: | ||
As we focus on providing children facilities especially the education needs, we will roughly measure the approximate ratio of available educational facilities on each subzone, number of pre-school, kindergarten and pre-schools, and lastly the total of 0-9 age group. | As we focus on providing children facilities especially the education needs, we will roughly measure the approximate ratio of available educational facilities on each subzone, number of pre-school, kindergarten and pre-schools, and lastly the total of 0-9 age group. | ||
| + | |||
| + | [[File:Assumption table.jpg|center|300px]] | ||
| + | [[File:Generating childcare needed.jpg|center|500px]] | ||
| + | |||
| + | Ref: | ||
| + | * “Punggol has an estimated HDB resident population of 187,800 and we manage 49,909 flats in the town (as of September 2019)” | ||
| + | * https://www.hdb.gov.sg/cs/infoweb/about-us/history/hdb-towns-your-home/punggol | ||
| + | * https://mothership.sg/2019/09/punggol-point-bto-september-2019/ | ||
| + | |||
| + | Facilities to Cater for the Younger Population’s Needs: | ||
| + | * Mainly narrowed down in ensuring that school for 0-9 years old age group are all provided | ||
| + | * Building of new library looking at the trends of younger group rise: | ||
| + | ** However its already planned. Punggol's library is currently being built and will be available in 2021. | ||
| + | *** [https://www.channelnewsasia.com/news/singapore/punggol-town-hub-2021-hawker-centre-library-10800152 “Punggol Town Hub to open in 2021”] | ||
| + | |||
| + | |||
| + | == Land Suitability Analysis (Green Zone) For School Redevelopment == | ||
| + | In this section we will explore options in meeting the younger population needs especially in catering for the preschool and primary school needs as mentioned in the previous section. We note that there is a greater demand yet limited supply of schools in order to fulfill the Masterplan 2019’s vision of Punggol as a place to play-work-learn-live. Going back to the numbers, 5 out 7 subzones in Punggol are currently growing in terms of the number of population between 0 - 9 years old. Moreover, a further migration of the economic active especially the newly married couples through the recent purchase of BTOs will pose as an increase potential number of these age group. | ||
| + | [[File:Current Available Childcare.jpg|center|500px]] | ||
| + | The above map shows the currently available childcare centre and schools in Punggol retrieved from the Data.Gov site, shows a lack of supply for the demand to meet the current vision. Next, we will evaluate alternative recommendations that can be performed. We will apply a land suitability analysis to predict where in Punggol subzones can we add on the number of supply for this need. | ||
| + | |||
| + | For this land suitability, we will develop what we call a green zone to identify preferred locations with multi-weighted criterias with the following suggested factors: | ||
| + | * '''Economic factor''': < =15deg slope for an ease of construction development which results in no additional time and manpower cost. | ||
| + | * '''Road Accessibility factor''': <= 100m from roads for ease of private transportation. | ||
| + | * '''Children Risks Avoidance factor''': >= 150m away from school as a highly important factor as parents would want to send their kids to a less risky locations with lesser construction areas. | ||
| + | * '''Favourable Objects Proximity factor''': <= 500m from favourable objects for better outdoor learning possibilities such as empty fields, grass, playground, etc. | ||
| + | * '''Public Transport Accessibility factor''': <= 200m from public transportation data points for convenience of majority population. | ||
| + | * '''Residential Proximity factor''': <= 300m from residentials because we want to go back to the Masterplan 2019 vision to create Punggol as a place to play-work-learn-live. | ||
Revision as of 00:30, 17 November 2019
Contents
- 1 Population Growth Trend & Forecast
- 2 Matilda’s Population Trend
- 3 Northshore’s Population Trend
- 4 Punggol Town Centre’s Population Trend
- 5 Punggol Field’s Population Trend
- 6 Waterway East’s Population Trend
- 7 *Coney Island and Punggol Canal have 0 population recorded so we are not going to focus on these particular subzones
- 8 Going deeper into analysing each younger age group education needs
- 9 Matilda’s Younger Group Population Trend
- 10 Northshore’s Younger Group Population Trend
- 11 Punggol Field’s Younger Group Population Trend
- 12 Punggol Town Centre’s Younger Group Population Trend
- 13 Waterway East’s Younger Group Population Trend
- 14 Land Suitability Analysis (Green Zone) For School Redevelopment
Population Growth Trend & Forecast
In this population we will be using the Singstat’s `Singapore Residents by Planning AreaSubzone, Age Group, Sex and Type of Dwelling, June 2011-2019` data provided. There are few objectives that we want to understand from the population historical data:
- Understand the population trend for each subzone and age group classification (younger group, economic active group, and aged population) in order to facilitate basic necessities for each age group.
- Forecast the future population trend up to 2024 using the auto ARIMA model to re-evaluate the MP19.
- Interpreting the Arima model
- Similar application of ARIMA model in forecasting population trends:
- Zakria, Muhammad & Muhammad, Faqir. (2009). Forecasting the population of Pakistan using ARIMA models.. Agri. Sci. 46.
- Nyonyi, T and Mutongi, C. (2019). Prediction of total population in Togo using ARIMA models.
- Lin, Bin-Shan, et al. “Using ARIMA Models to Predict Prison Populations.” Journal of Quantitative Criminology, vol. 2, no. 3, 1986, pp. 251–264. JSTOR, www.jstor.org/stable/23365635.
- Make recommendations according to the population trend insights.
Data Cleaning Methods
- Data is cleaned to only show Punggol PA and its subzones.
- Age group were classified into a new group with the following requirement:
- Younger Population: 0-24
- Economic Active: 25-64
- Aged Population: 65 and above
- Summation group by was performed according to each subzone and age group classification.
- Reverse data frame vector was performed to swap rows and columns formatting as it is required to perform graph visualisation in R.
- Methods Deployed in RPubs: Punggol Forecast Population Analysis
- Methods Deployed in RPubs: Punggol Peak Hour Travel Pattern Analysis
Visualisations
- Datatable view of forecast population per age group classification and subzones.
- Plotting time series line graph on each subzone’s population trend.
- Plotting the ARIMA forecasted population on each Subzone.
Results
Matilda’s Population Trend
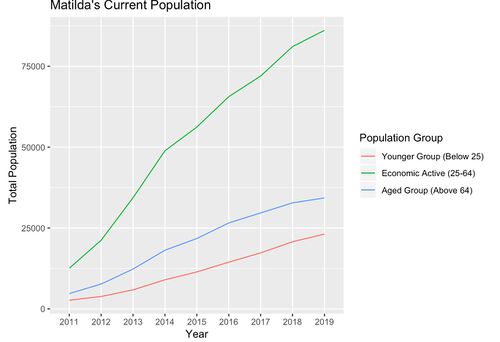
First, the Matilda subzone is one of the most populated subzones in Punggol. The Matilda subzone has been populated ever since the initiation of HDB buildings in Punggol. The subzone is continuously growing ever since 2011 for all age groups. Interestingly the subzone is predominantly filled with the economic active group. Based on the 9 years trend, an ARIMA (0,1,0) with random walk were applied to predict the population for the next 5 years. We predict that there is a major growth in population for this subzone. We anticipate the there is a growing number of younger age group as the economic active age group might plan to start a family.
Northshore’s Population Trend
Next, the Northshore subzone is rather a newer region in Punggol. We haven’t observed a significant rise in terms of population. However, there are on-going government plans of developing smart HDB in these regions for example the Punggol Northshore Residences I and II.
For the upcoming next five years or so, the number of populations might increase exponentially, especially with the attractive government’s plan for the smart HDB which in turn will probably attract most of the economic active group.
Ref: 1. https://www.straitstimes.com/sites/default/files/attachments/2019/04/22/ST_20190422_ITHOMEFINAL_4787163.pdf 2. https://esales.hdb.gov.sg/bp25/launch/19sep/bto/19SEPBTO_page_2671/about0.html#
Punggol Town Centre’s Population Trend
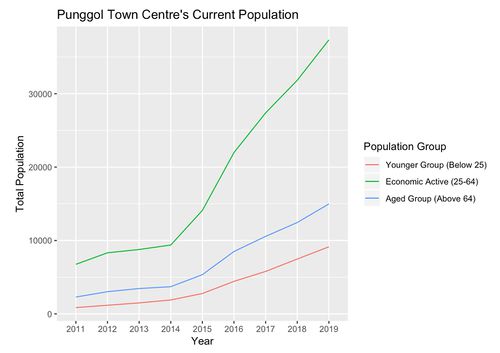
The Punggol Town Centre is located at the heart of Punggol planning area. This shows a major exponential growth. This exponential growth could have been caused by the past few year’s major development by the government, especially through the integrated development near Punggol MRT also the the new HDB appearance at the Nibong LRT proximity.
We are projecting that exponential growth will diminish as most of the region haven’t progressed much from previous Masterplan 2008 and Masterplan 2014. Additionally, most of the locations in the area are currently occupied or already planned. However, with the current figure of the economic active population there is a possibility that the younger group might still spike due to family plans and rather mid age group living in the area. We should not deny the potential addition of the aged population even though it might not rise significantly for the next 5 years, but however an early planning is always good to ensure that needs are always met, example: building eldery centres as this subzone currently has approximately 9000. We recommend a child centre built nearby homes as there are only a few in this region.
Punggol Field’s Population Trend
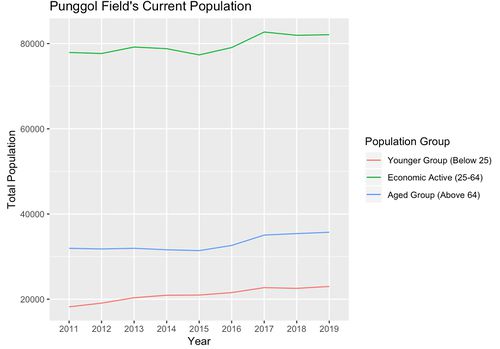
The Punggol Field subzone is rather been mostly an occupied zone since 2011 and growing at a rather consistent rate ever since. According to the change model analysis as described in the previous section. This area had mostly minor changes to an additional education institute and residential facilities. We are not projecting that there will be major changes in terms of figure, but there is a possibility that the aged group might rise about 4000 for the next 5 years, thus suggesting the need of more eldery facilities.
Waterway East’s Population Trend
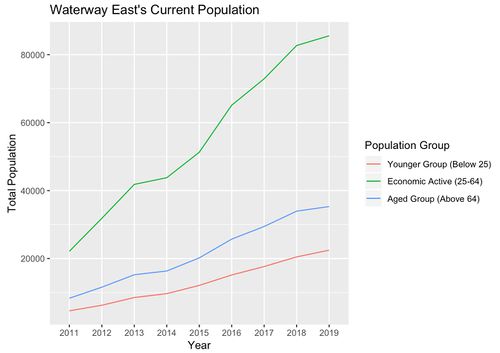
Similar to Matilda and Punggol Town Centre, the Waterway East has one of the fastest growing subzones in Punggol. We can observe a similar trend of age group division, where the economic active dominates the population. In terms of its current figure, Waterway East have reached Punggol Field’s figure. However, when it comes to potential growth, we project that there will be an increased number of addition across all age group classifications.
*Coney Island and Punggol Canal have 0 population recorded so we are not going to focus on these particular subzones
Analysing The Younger Population’s Needs
Going deeper into analysing each younger age group education needs
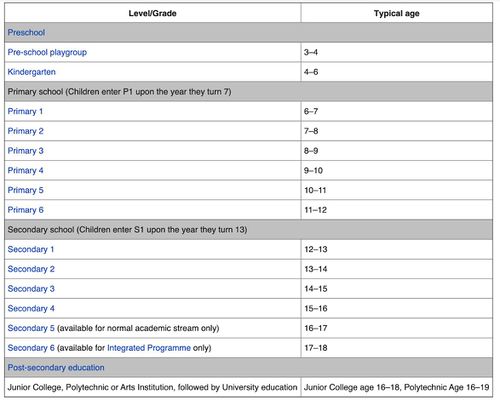
In this section we will perform a micro analysis of the younger age group needs. The diagram above clearly separates different education stages of each young group classification. We will make recommendations whether there is a need to revise the current availability pre-school, kindergarten, primary school, secondary school, and post-secondary education.
Matilda’s Younger Group Population Trend
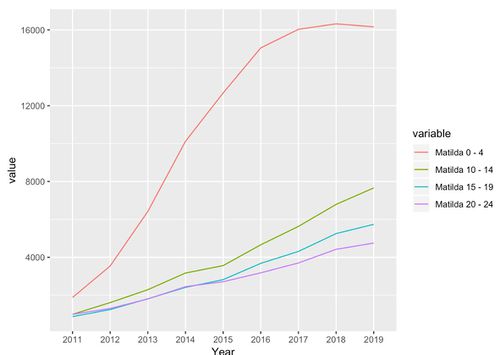
The above line chart depicts the historical younger group population trend in Matilda’s subzone. Interestingly the subzone are predominantly filled with age group 0 - 9 which emphasises the need of having preschool and primary school nearby residential buildings. Proximity to residentials are important in this subzone so that parents can drop or pick-up their kids before or after work conveniently. From this figure we can conclude that for the next 5 years, preschools, kindergarten and primary schools are priority.
Northshore’s Younger Group Population Trend
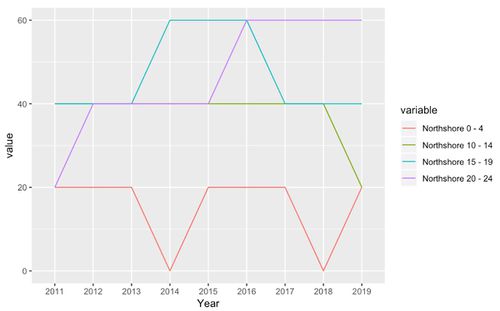
As per discussed under the “Northshore’s Population Trend” section, the government are rolling out HDB on-going projects that will be projected to complete in 4 or more years. Thus, even though the younger population figure seems to be less significant as compared to other subzones, the subzone will experience a major spike once units are completed. Thus, there is a need for proper planning to ensure that the younger age group needs are met.
Punggol Field’s Younger Group Population Trend
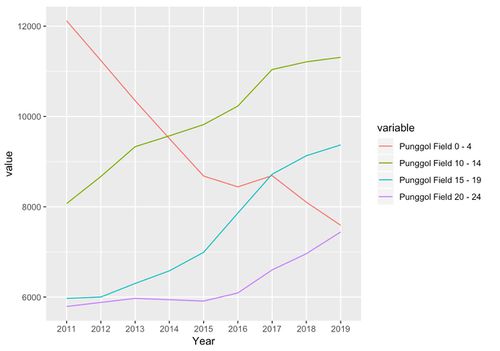
The Punggol Field’s subzone is rather different as compared to Matilda’s. Younger age group comprises of majority 10-19 years old which touches primary, secondary, and some post-secondary level of education. Despite the pretty big ratio of secondary and post-secondary figures, our team believes these planning facilities for these 2 stage of education should consider a higher level planning zone, for example across Punggol planning area instead of just subzone. As age group tend to be more independent, accessibility is not an issue as long as the number of supply meets the demand. Thus we are only prioritising the facility for primary school here.
Punggol Town Centre’s Younger Group Population Trend
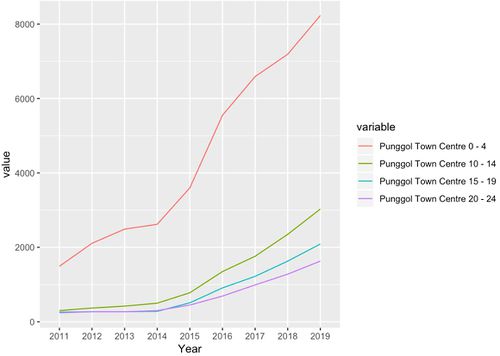
The Punggol Town Centre have roughly consistent growth rate in terms of number per each group. Our team observes a pretty similar case to the Matilda’s Subzone where total population of 0-9 age group are way more than the other age groups. We will prioritise in building more preschools, kindergarten and primary schools for these age groups.
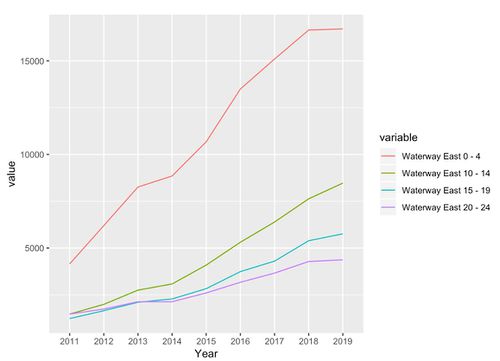
Waterway East’s Younger Group Population Trend
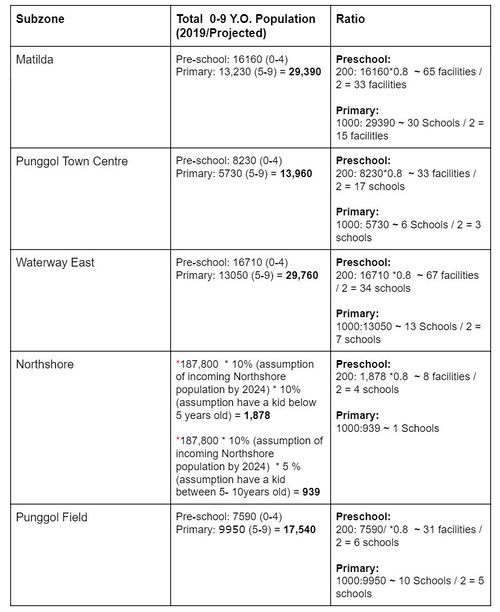
The Waterway East’s have also a roughly consistent dominant total of age group 0 - 9. Our team believes that this trend of dominant age group of 0 - 9 years old is not random, the fact that it has appeared to be distinctly apparent on 3 out of 5 occupied subzone. This trend also implies that most of current Punggol residents are young family and it is continuously adding. If we consider the current social norm in Singapore, newly married couples will tend to look for a new BTO as they venture out to a new phase of life together. Coupling with the recent BTO launches especially in the Northshore subzone, we expect the same pattern to happen again. Where it emphasis the need of more children facilities in the region.
As we focus on providing children facilities especially the education needs, we will roughly measure the approximate ratio of available educational facilities on each subzone, number of pre-school, kindergarten and pre-schools, and lastly the total of 0-9 age group.
Ref:
- “Punggol has an estimated HDB resident population of 187,800 and we manage 49,909 flats in the town (as of September 2019)”
- https://www.hdb.gov.sg/cs/infoweb/about-us/history/hdb-towns-your-home/punggol
- https://mothership.sg/2019/09/punggol-point-bto-september-2019/
Facilities to Cater for the Younger Population’s Needs:
- Mainly narrowed down in ensuring that school for 0-9 years old age group are all provided
- Building of new library looking at the trends of younger group rise:
- However its already planned. Punggol's library is currently being built and will be available in 2021.
Land Suitability Analysis (Green Zone) For School Redevelopment
In this section we will explore options in meeting the younger population needs especially in catering for the preschool and primary school needs as mentioned in the previous section. We note that there is a greater demand yet limited supply of schools in order to fulfill the Masterplan 2019’s vision of Punggol as a place to play-work-learn-live. Going back to the numbers, 5 out 7 subzones in Punggol are currently growing in terms of the number of population between 0 - 9 years old. Moreover, a further migration of the economic active especially the newly married couples through the recent purchase of BTOs will pose as an increase potential number of these age group.
The above map shows the currently available childcare centre and schools in Punggol retrieved from the Data.Gov site, shows a lack of supply for the demand to meet the current vision. Next, we will evaluate alternative recommendations that can be performed. We will apply a land suitability analysis to predict where in Punggol subzones can we add on the number of supply for this need.
For this land suitability, we will develop what we call a green zone to identify preferred locations with multi-weighted criterias with the following suggested factors:
- Economic factor: < =15deg slope for an ease of construction development which results in no additional time and manpower cost.
- Road Accessibility factor: <= 100m from roads for ease of private transportation.
- Children Risks Avoidance factor: >= 150m away from school as a highly important factor as parents would want to send their kids to a less risky locations with lesser construction areas.
- Favourable Objects Proximity factor: <= 500m from favourable objects for better outdoor learning possibilities such as empty fields, grass, playground, etc.
- Public Transport Accessibility factor: <= 200m from public transportation data points for convenience of majority population.
- Residential Proximity factor: <= 300m from residentials because we want to go back to the Masterplan 2019 vision to create Punggol as a place to play-work-learn-live.
