Difference between revisions of "G1-Group01 Datacleaning"
Jump to navigation
Jump to search
| Line 19: | Line 19: | ||
| − | + | Due to some of files were not in the proper format for our analysis. | |
| − | Thus, our team used R and tableau for our data cleaning and data Visualization. However, in this section, we will only share how we use the | + | Thus, our team used R and tableau for our data cleaning and data Visualization. However, in this section, we will only share how we use the R code to "Geocode" and "data clean". |
| + | |||
| + | '''Geocode''' | ||
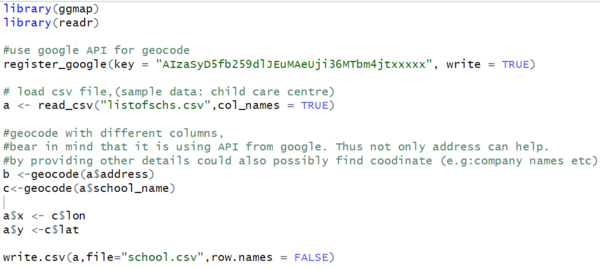
| + | Our group used R package "ggmap" and the function "geocode". And the coordinate it has generated will be base on projection 4326. Thus we need to export the file again to become projection 3414 for our further analysis. | ||
| + | Requirement of using ggmap: | ||
| + | |||
| + | 1. "ggmap" must be installed in your R studio <br/> | ||
| + | 2. Must have google API in order to require information from google | ||
| + | |||
| + | [[File:Geocode.jpg|600px]] | ||
Revision as of 14:52, 16 November 2019
Due to some of files were not in the proper format for our analysis.
Thus, our team used R and tableau for our data cleaning and data Visualization. However, in this section, we will only share how we use the R code to "Geocode" and "data clean".
Geocode Our group used R package "ggmap" and the function "geocode". And the coordinate it has generated will be base on projection 4326. Thus we need to export the file again to become projection 3414 for our further analysis. Requirement of using ggmap:
1. "ggmap" must be installed in your R studio
2. Must have google API in order to require information from google
