Difference between revisions of "SMT201 AY2019-20G2 Ex2 Lee Sean Jin"
| (27 intermediate revisions by the same user not shown) | |||
| Line 19: | Line 19: | ||
[[File:TakeHome02 Map1.png|1200px|thumb|center|Data Source: Master Plan 2014 Subzone Boundary (No Sea) (SHP) from URA [https://data.gov.sg/dataset/master-plan-2014-subzone-boundary-no-sea]. Roads, Buildings and Natural (SHP) from OpenStreetMap [https://download.bbbike.org/osm/bbbike/Singapore/]. ASTER Global Digital Elevation Model (GDEM) dataset jointly prepared by NASA and METI, Japan [https://search.earthdata.nasa.gov/search?m=-7.175!25.59375!1!1!0!0%2C2]]] | [[File:TakeHome02 Map1.png|1200px|thumb|center|Data Source: Master Plan 2014 Subzone Boundary (No Sea) (SHP) from URA [https://data.gov.sg/dataset/master-plan-2014-subzone-boundary-no-sea]. Roads, Buildings and Natural (SHP) from OpenStreetMap [https://download.bbbike.org/osm/bbbike/Singapore/]. ASTER Global Digital Elevation Model (GDEM) dataset jointly prepared by NASA and METI, Japan [https://search.earthdata.nasa.gov/search?m=-7.175!25.59375!1!1!0!0%2C2]]] | ||
<br> | <br> | ||
| + | === Accessibility Factor (Roads)=== | ||
| + | We identify roads to be a factor in determining accessibility because the proximity of the roads to the construction site will affect the ease of transporting building materials to a large degree. A large proportion of the roads in Gombak are service roads, with a minority being tracks. In the map above, the service roads lines are coloured pink and are thicker than the tracks which are coloured grey. There is a high concentration of roads in the East of Gombak. | ||
<br> | <br> | ||
| + | === Health Risk Factor (Buildings) === | ||
| + | We identify buildings to be an important factor in assessing the health risk arose from the Quarantine Centre. As the site will contain patients with easily transmittable diseases, it is important to ensure that the location chosen be away from buildings with human traffic. Upon reviewing the data provided from BBBike, we realise that the building types are unknown for a significant proportion of the buildings. Using Google Maps, we are able to manually identify the types of buildings present in Gombak which helps us to identify the human traffic in the buildings. A large proportion of residential buildings are located along the North and West edges of Gombak. | ||
| + | <br> | ||
| + | === Natural conservation factor (Natural features) === | ||
| + | We identify natural features to be a factor in determining the natural conservation factor. As evident from the map, the natural features is a large waterbody in the centre of Gombak with a river in the East of Gombak. There is also a forest located in the centre of the map and a high concentration of parks in the South West region of Gombak. | ||
| + | <br> | ||
| + | === Economic Factor (Digital Elevation) === | ||
| + | We identify digital elevation to be an economic factor as it affects the cost of construction to a large degree. The steeper the slope, the higher the developmental costs due to more cut-and-fill occuring. As evident in the maps, the North, East and West edges of Gombak have lower elevation, while the central and South of Gombak have higher elevation. | ||
| + | <br> | ||
| + | = Proximity Analysis of the identified features = | ||
<div class="center" style="width: auto; margin-left: auto; margin-right: auto;">'''Proximity Analysis of the features'''</div> | <div class="center" style="width: auto; margin-left: auto; margin-right: auto;">'''Proximity Analysis of the features'''</div> | ||
[[File:Map2.png|1200px|thumb|center|Data Source: Master Plan 2014 Subzone Boundary (No Sea) (SHP) from URA [https://data.gov.sg/dataset/master-plan-2014-subzone-boundary-no-sea]. Roads, Buildings and Natural (SHP) from OpenStreetMap [https://download.bbbike.org/osm/bbbike/Singapore/]. ASTER Global Digital Elevation Model (GDEM) dataset jointly prepared by NASA and METI, Japan [https://search.earthdata.nasa.gov/search?m=-7.175!25.59375!1!1!0!0%2C2]]] | [[File:Map2.png|1200px|thumb|center|Data Source: Master Plan 2014 Subzone Boundary (No Sea) (SHP) from URA [https://data.gov.sg/dataset/master-plan-2014-subzone-boundary-no-sea]. Roads, Buildings and Natural (SHP) from OpenStreetMap [https://download.bbbike.org/osm/bbbike/Singapore/]. ASTER Global Digital Elevation Model (GDEM) dataset jointly prepared by NASA and METI, Japan [https://search.earthdata.nasa.gov/search?m=-7.175!25.59375!1!1!0!0%2C2]]] | ||
<br> | <br> | ||
| + | === Road Proximity === | ||
| + | Dark areas of the map denotes closer proximity to the roads. Land areas that are more than 400m away from roads are denoted white. As discussed earlier, the darker areas will be more suitable for building the Quarantine Center. | ||
<br> | <br> | ||
| + | === Building Proximity ==== | ||
| + | Dark areas of the map denotes closer proximity to the buildings. Land areas more than 400m away from the buildings are denoted white. As discussed earlier, the most suitable areas for building the Quarantine Center will be in the white areas of the map. | ||
| + | <br> | ||
| + | === Natural Features Proximity === | ||
| + | Dark areas of the map denotes close proximity to the natural features. Land areas more than 400m away from the buildings are denoted white. As discussed previously, the most suitable areas for building the Quarantine Center will be in the white areas of the map. | ||
| + | <br> | ||
| + | === Slope Analysis === | ||
| + | Brighter areas of the map denote steeper slopes whereas the darker areas denote areas that are less steep. The steepest slopes in Gombak have a gradient of approximately 69%. As discussed previously, the most suitable areas for building the Quarantine Center will be in the darker regions of the map. | ||
| + | <br> | ||
| + | |||
= Criterion Scores = | = Criterion Scores = | ||
| + | In order to compare the suitability of each of the factors discussed earlier, we first need to standardize the proximity analysis. Normalisation will be used to bring the scale of proximity of each factor to be equal, where 1 will be the maximum and 0 the minimum. This is done using the Minimum Maximum standardisation method. | ||
| + | <br> | ||
| + | <br> | ||
| + | The formula for normalisation is as below: <br> | ||
| + | MM(Xij) = (Feature Proximity - Min(Feature Proximity) / (Max(Feature Proximity) - Min(Feature Proximity) | ||
| + | <br> | ||
| + | The minimum and maximum proximity numbers are generated from "Layer Properties" in QGIS as shown below. | ||
| + | [[File:StatisticsRoads.png|800px|thumb|center|Source: QGIS screenshot]] | ||
| + | <br> | ||
| + | <br> | ||
| + | In determining the criterion scores of each factor, we must take note to standardise the colour codes where lighter regions of the map are more desirable. <br> | ||
| + | <br> | ||
| + | Accessibility: The closer proximity to the roads, the more desirable it is and thus a higher suitability score should be given. We inverse the normalised results using the formula below: <br> | ||
| + | 1 - Normalised results of the Road proximity | ||
| + | <br> | ||
| + | Health Risk: The further away from the buildings, the more desirable it is and thus a higher suitability score should be given. There is no need to inverse the normalised results. | ||
| + | <br> | ||
| + | <br> | ||
| + | Natural Conservation: The further away from the natural features, the more desirable it is and thus a higher suitability score should be given. There is no need to inverse the normalised results. | ||
| + | <br> | ||
| + | <br> | ||
| + | Slope Analysis: The less steep the slope, the more desirable it is and thus a higher suitability score should be given. We inverse the normalised results using the formula below: <br> | ||
| + | 1 - Normalised results of the slope analysis | ||
| + | <br> | ||
| + | Below is an example of normalisation using the raster calculator function is QGIS. | ||
| + | [[File:Normalised Roads.png|800px|thumb|center|Source: QGIS screenshot]] | ||
| + | <br> | ||
| + | <br> | ||
<div class="center" style="width: auto; margin-left: auto; margin-right: auto;">'''Criterion scores of the Proximity to Roads, Buildings, Natural Features and Slope Analysis '''</div> | <div class="center" style="width: auto; margin-left: auto; margin-right: auto;">'''Criterion scores of the Proximity to Roads, Buildings, Natural Features and Slope Analysis '''</div> | ||
[[File:TakeHome02 Map3.png|1200px|thumb|center|Data Source: Master Plan 2014 Subzone Boundary (No Sea) (SHP) from URA [https://data.gov.sg/dataset/master-plan-2014-subzone-boundary-no-sea]. Roads, Buildings and Natural (SHP) from OpenStreetMap [https://download.bbbike.org/osm/bbbike/Singapore/]. ASTER Global Digital Elevation Model (GDEM) dataset jointly prepared by NASA and METI, Japan [https://search.earthdata.nasa.gov/search?m=-7.175!25.59375!1!1!0!0%2C2]]] | [[File:TakeHome02 Map3.png|1200px|thumb|center|Data Source: Master Plan 2014 Subzone Boundary (No Sea) (SHP) from URA [https://data.gov.sg/dataset/master-plan-2014-subzone-boundary-no-sea]. Roads, Buildings and Natural (SHP) from OpenStreetMap [https://download.bbbike.org/osm/bbbike/Singapore/]. ASTER Global Digital Elevation Model (GDEM) dataset jointly prepared by NASA and METI, Japan [https://search.earthdata.nasa.gov/search?m=-7.175!25.59375!1!1!0!0%2C2]]] | ||
| + | <br> | ||
| + | === Accessibility Score === | ||
| + | As evident from the accessibility factor map, we observe that there are many white areas due to the dense road network consisting of service and track lines. We note that there is a concentrated dark area in the South East portion of the map due to a lack of roads in that region. | ||
| + | <br> | ||
| + | <br> | ||
| + | === Health Risk Score === | ||
| + | As evident from the health risk factor map, a large proportion of the map is dark, due to the dense residential and military buildings present in Gombak. In the south edges of Gombak, lighter colours can be seen which denotes that the area is more suitable for building the Quarantine Site. | ||
| + | <br> | ||
| + | <br> | ||
| + | === Natural Conservation Score === | ||
| + | Due to the natural features concentrated around the North, East and West areas of Gombak, the map is largely dark. However, there is a light coloured line running from the South to Center of Gombak which is suitable for building the Quarantine Center as it is far away from natural features. | ||
| + | <br> | ||
| + | <br> | ||
| + | === Economic Score === | ||
| + | Despite Gombak having high digital elevation in the center of the map, there are not many steep slopes which results in a large proportion of the map being lighter coloured. Dark lines in the map denote steep slopes and are mainly found in the center of Gombak. | ||
| + | <br> | ||
| + | <br> | ||
= Analytical Hierarchical Process input matrix and result report = | = Analytical Hierarchical Process input matrix and result report = | ||
| Line 33: | Line 102: | ||
<br> | <br> | ||
<br> | <br> | ||
| + | Using the template from SCBUK, we are able to produce the weightings for each factor to derive the combined suitability map. <br> | ||
| + | The AHP matrix is used to generate the results report by calculating the relative importance of each factor. By doing a pairwise comparison, relatively more important factors will have a larger value, whereas relatively less important factors will have a lower value. <br> | ||
| + | The order of importance of the factors is as below: <br> | ||
| + | 1. Health risk factor | ||
| + | 2. Accessibility factor | ||
| + | 3. Natural Conservation factor | ||
| + | 4. Economic factor | ||
| + | <br> | ||
| + | The health risk factor is the most important because if the Quarantine Center is not placed sufficiently far enough from the population, there is high risk of spreading the disease which is extremely undesirable. It over-weighs the other factors due to the high health risks involved. | ||
| + | <br> | ||
| + | <br> | ||
| + | I ranked accessibility to be the next important factor as the close proximity to roads will provide greater convenience to building the site. This allows the site to be constructed quickly and efficiently so that it can be put to use faster and isolate people with the disease. | ||
| + | <br> | ||
| + | <br> | ||
| + | The natural conservation factor and economic factor are relatively unimportant as the core objective of building the Quarantine Center is to isolate the patients. It is relatively unimportant to consider the costs and to preserve nature when the general health of the population is at stake. | ||
| + | <br> | ||
| + | <br> | ||
| + | The resultant weights generated is as follows: | ||
| + | 1. Health risk factor: 0.542 | ||
| + | 2. Accessibility factor: 0.314 | ||
| + | 3. Natural Conservation factor: 0.091 | ||
| + | 4. Economic factor: 0.053 | ||
| + | <br> | ||
| + | The weights generated are consistent to the AHP model as shown by the 1% consistency check score generated, which means that we can use these weights for further analysis. | ||
| − | = Suitability Analysis = | + | = Combined Suitability Analysis = |
| + | We generate the combined scoring map using the following in formula in raster calculator: | ||
| + | <br> | ||
| + | (BuildingSuitability * 0.542) + (Natural Feature Suitability * 0.091) + (Road Suitability * 0.314) + (Slope Suitablity * 0.053) | ||
| + | <br> | ||
| + | [[File:Combined.png|800px|thumb|center|Source: QGIS screenshot]] | ||
| + | <br> | ||
[[File:Part4.png|1200px|thumb|center|Data Source: Master Plan 2014 Subzone Boundary (No Sea) (SHP) from URA [https://data.gov.sg/dataset/master-plan-2014-subzone-boundary-no-sea]. Roads, Buildings and Natural (SHP) from OpenStreetMap [https://download.bbbike.org/osm/bbbike/Singapore/]. ASTER Global Digital Elevation Model (GDEM) dataset jointly prepared by NASA and METI, Japan [https://search.earthdata.nasa.gov/search?m=-7.175!25.59375!1!1!0!0%2C2]]] | [[File:Part4.png|1200px|thumb|center|Data Source: Master Plan 2014 Subzone Boundary (No Sea) (SHP) from URA [https://data.gov.sg/dataset/master-plan-2014-subzone-boundary-no-sea]. Roads, Buildings and Natural (SHP) from OpenStreetMap [https://download.bbbike.org/osm/bbbike/Singapore/]. ASTER Global Digital Elevation Model (GDEM) dataset jointly prepared by NASA and METI, Japan [https://search.earthdata.nasa.gov/search?m=-7.175!25.59375!1!1!0!0%2C2]]] | ||
<br> | <br> | ||
| − | <div class="center" style="width: auto; margin-left: auto; margin-right: auto;">''' | + | Using the weights from generated from the AHP, we are able to derive the combined suitability map. <br> |
| + | Lighter areas in the map denote more suitable areas for the Quarantine Center. As we discussed early, there is a higher chance that the site is built in the South regions of Gombak. This combined suitability map confirms our prediction as there is a high concentration of light areas located at the Southern edges of Gombak. | ||
| + | <br> | ||
| + | <br> | ||
| + | To improve the intuitiveness of analysis the combined suitability map, we reclassify the map into percentage using the formula shown in the screenshot below. We use the normalisation method again to standardise the scoring into percentage. The formula used is as below: <br> | ||
| + | ((Combined Suitability - Min(Suitability) / (Max(Suitability) - Min(Suitability)) * 100 | ||
| + | <br> | ||
| + | [[File:ScoringFinal.png|800px|thumb|center|Source: QGIS screenshot]] | ||
| + | <div class="center" style="width: auto; margin-left: auto; margin-right: auto;">'''Scoring map in %'''</div> | ||
[[File:Part5.png|1200px|thumb|center|Data Source: Master Plan 2014 Subzone Boundary (No Sea) (SHP) from URA [https://data.gov.sg/dataset/master-plan-2014-subzone-boundary-no-sea]]] | [[File:Part5.png|1200px|thumb|center|Data Source: Master Plan 2014 Subzone Boundary (No Sea) (SHP) from URA [https://data.gov.sg/dataset/master-plan-2014-subzone-boundary-no-sea]]] | ||
| + | <br> | ||
| + | <br> | ||
| + | We observe that the southern tip of Gombak has the lightest colour, which translates into the highest suitability for building the Quarantine Center. <br> | ||
| + | Next, we will then filter our the area with high suitability scores to identify the best areas to build the Quarantine Center. | ||
| + | <br> | ||
= Suggested location for the National Communicable Disease Quarantine Centre = | = Suggested location for the National Communicable Disease Quarantine Centre = | ||
| + | Using the "Reclassify by table" function, we categorise the area into 2 categories, one with suitability scores of above 70% and one with suitability scores of 70% and below. This gives us the resultant map as shown below. | ||
| + | <br> | ||
| + | [[File:Reclassified.png|800px|thumb|center|Source: QGIS screenshot]] | ||
[[File:Part6.png|1200px|thumb|center|Data Source: Master Plan 2014 Subzone Boundary (No Sea) (SHP) from URA [https://data.gov.sg/dataset/master-plan-2014-subzone-boundary-no-sea]]] | [[File:Part6.png|1200px|thumb|center|Data Source: Master Plan 2014 Subzone Boundary (No Sea) (SHP) from URA [https://data.gov.sg/dataset/master-plan-2014-subzone-boundary-no-sea]]] | ||
<br> | <br> | ||
| + | Using the above map, we are able to identify the most suitable area to place the Quarantine Center. | ||
[[File:Criteriafulfilled.png|800px|thumb|center|Source: Screenshot from QGIS]] | [[File:Criteriafulfilled.png|800px|thumb|center|Source: Screenshot from QGIS]] | ||
| + | <br> | ||
| + | Using the "Raster to Vector" function, we are able to derive the area of the site, which is 31,385m2. | ||
| + | <br> | ||
| + | From this analysis, we are able to identify the most suitable site to build the Quarantine Center with a contiguous area of 10,00m^2 within the Gombak subzone. However, limitations to this study include the assumption that no population exists outside the Southern edge of Gombak where we suggest the Quarantine Center to be placed. | ||
| + | <br> | ||
| + | |||
| + | = Limitation and future plans = | ||
| + | [[File:Map7.png|1200px|thumb|center|Data Source: Master Plan 2014 Subzone Boundary (No Sea) (SHP) from URA [https://data.gov.sg/dataset/master-plan-2014-subzone-boundary-no-sea]. Building features data from OpenStreetMap [https://download.bbbike.org/osm/bbbike/Singapore/]]] | ||
| + | Upon exploring outside the Gombak subzone, we find that there is a concentrated cluster of residential buildings right outside the southern tip of Gombak belonging to another subzone. This will change our recommendation of placing the Quarantine Center at the suggested location as it will pose serious health risks to the population living right outside the Gombak subzone. This study of the Quarantine Center site recommendation shows that it is essential to consider all subzones when building new features especially when there are many factors affecting the recommendation. In cases where detrimental effects can result if the site is not chosen correctly, the population will suffer. Therefore we learn that the job of a urban city planner is not easy due to the complex decisions and factors that have to be considered. | ||
| + | <br> | ||
| + | In order to choose the best building site of the Quarantine Center within Gombak,there is a need to analyse areas outside Gombak as well to ensure that thorough analysis of factors are done. | ||
Latest revision as of 23:22, 10 November 2019
Contents
- 1 Objective
- 2 Analysis of the features identified above
- 3 Proximity Analysis of the identified features
- 4 Criterion Scores
- 5 Analytical Hierarchical Process input matrix and result report
- 6 Combined Suitability Analysis
- 7 Suggested location for the National Communicable Disease Quarantine Centre
- 8 Limitation and future plans
Objective
To identify a location suitable for building a National Communicable Disease Quarantine Centre. The selected site is located in the Gombak planning subzone, with a contiguous area of at least 10,000m2 and it must meet the following decision factors:
1. Economic factor: The selected site should avoid steep slope. This is because construction at steep slope tends to involve a lot of cut-and-fill and will lend to relatively higher development cost.
2. Accessibility factor: The selected site should be close to existing local roads, namely: service roads and tracks. This is to ensure easy transportation of building materials during the construction stage.
3. Health risk factor: The selected site should be away from population i.e. housing areas and offices in order to avoid disease spreading to the nearby population.
4. Natural conservation factor: The selected site should be away from forested land, park and water.
The main features of analysis as identified above will be as follows:
1. The Digital Elevation Map of Gombak.
2. Service roads and tracks in Gombak.
3. Buildings that has human traffic on a daily basis in Gombak.
4. Natural features containing forested land, parks and water bodies in Gombak.
Analysis of the features identified above
Accessibility Factor (Roads)
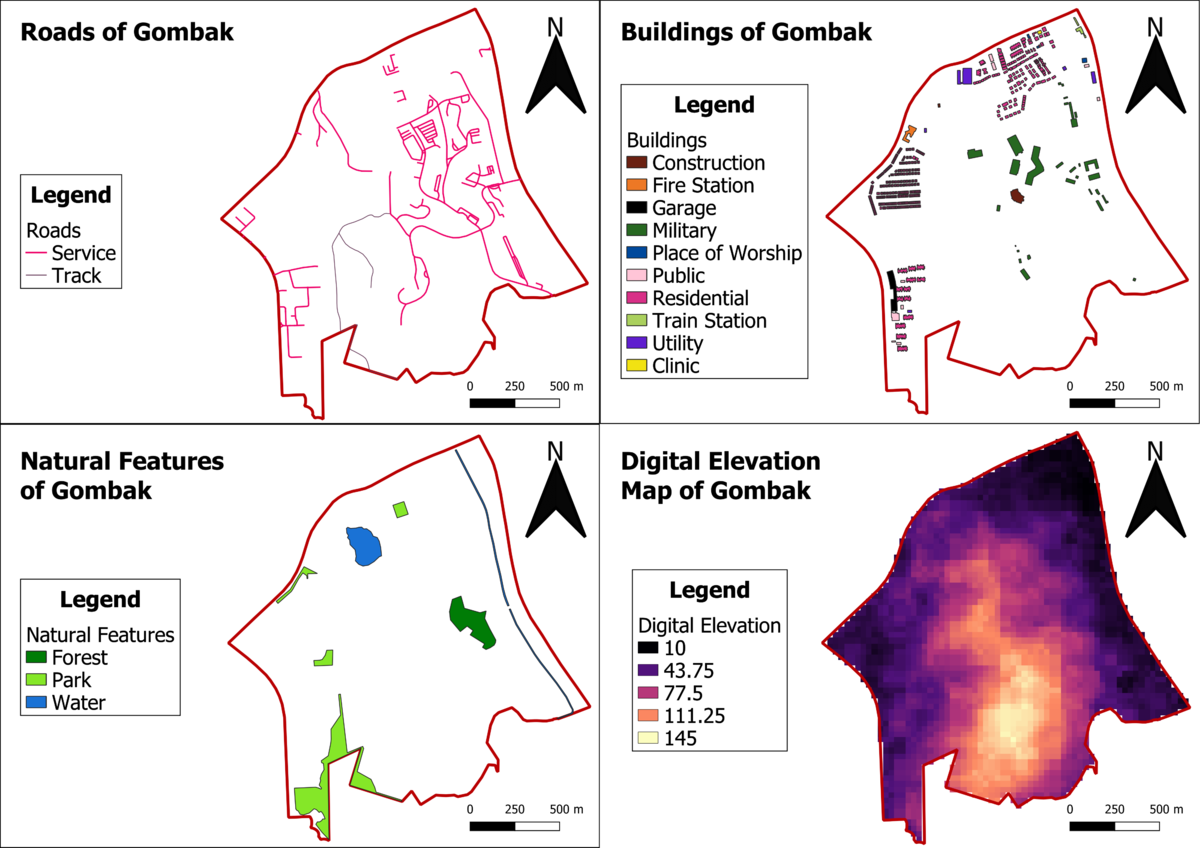
We identify roads to be a factor in determining accessibility because the proximity of the roads to the construction site will affect the ease of transporting building materials to a large degree. A large proportion of the roads in Gombak are service roads, with a minority being tracks. In the map above, the service roads lines are coloured pink and are thicker than the tracks which are coloured grey. There is a high concentration of roads in the East of Gombak.
Health Risk Factor (Buildings)
We identify buildings to be an important factor in assessing the health risk arose from the Quarantine Centre. As the site will contain patients with easily transmittable diseases, it is important to ensure that the location chosen be away from buildings with human traffic. Upon reviewing the data provided from BBBike, we realise that the building types are unknown for a significant proportion of the buildings. Using Google Maps, we are able to manually identify the types of buildings present in Gombak which helps us to identify the human traffic in the buildings. A large proportion of residential buildings are located along the North and West edges of Gombak.
Natural conservation factor (Natural features)
We identify natural features to be a factor in determining the natural conservation factor. As evident from the map, the natural features is a large waterbody in the centre of Gombak with a river in the East of Gombak. There is also a forest located in the centre of the map and a high concentration of parks in the South West region of Gombak.
Economic Factor (Digital Elevation)
We identify digital elevation to be an economic factor as it affects the cost of construction to a large degree. The steeper the slope, the higher the developmental costs due to more cut-and-fill occuring. As evident in the maps, the North, East and West edges of Gombak have lower elevation, while the central and South of Gombak have higher elevation.
Proximity Analysis of the identified features
Road Proximity
Dark areas of the map denotes closer proximity to the roads. Land areas that are more than 400m away from roads are denoted white. As discussed earlier, the darker areas will be more suitable for building the Quarantine Center.
Building Proximity =
Dark areas of the map denotes closer proximity to the buildings. Land areas more than 400m away from the buildings are denoted white. As discussed earlier, the most suitable areas for building the Quarantine Center will be in the white areas of the map.
Natural Features Proximity
Dark areas of the map denotes close proximity to the natural features. Land areas more than 400m away from the buildings are denoted white. As discussed previously, the most suitable areas for building the Quarantine Center will be in the white areas of the map.
Slope Analysis
Brighter areas of the map denote steeper slopes whereas the darker areas denote areas that are less steep. The steepest slopes in Gombak have a gradient of approximately 69%. As discussed previously, the most suitable areas for building the Quarantine Center will be in the darker regions of the map.
Criterion Scores
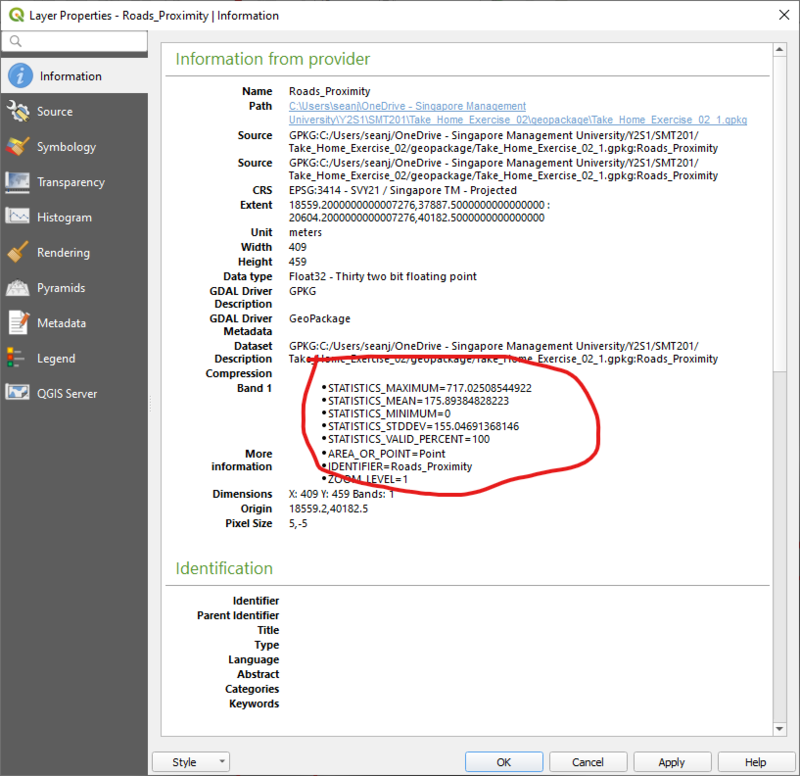
In order to compare the suitability of each of the factors discussed earlier, we first need to standardize the proximity analysis. Normalisation will be used to bring the scale of proximity of each factor to be equal, where 1 will be the maximum and 0 the minimum. This is done using the Minimum Maximum standardisation method.
The formula for normalisation is as below:
MM(Xij) = (Feature Proximity - Min(Feature Proximity) / (Max(Feature Proximity) - Min(Feature Proximity)
The minimum and maximum proximity numbers are generated from "Layer Properties" in QGIS as shown below.
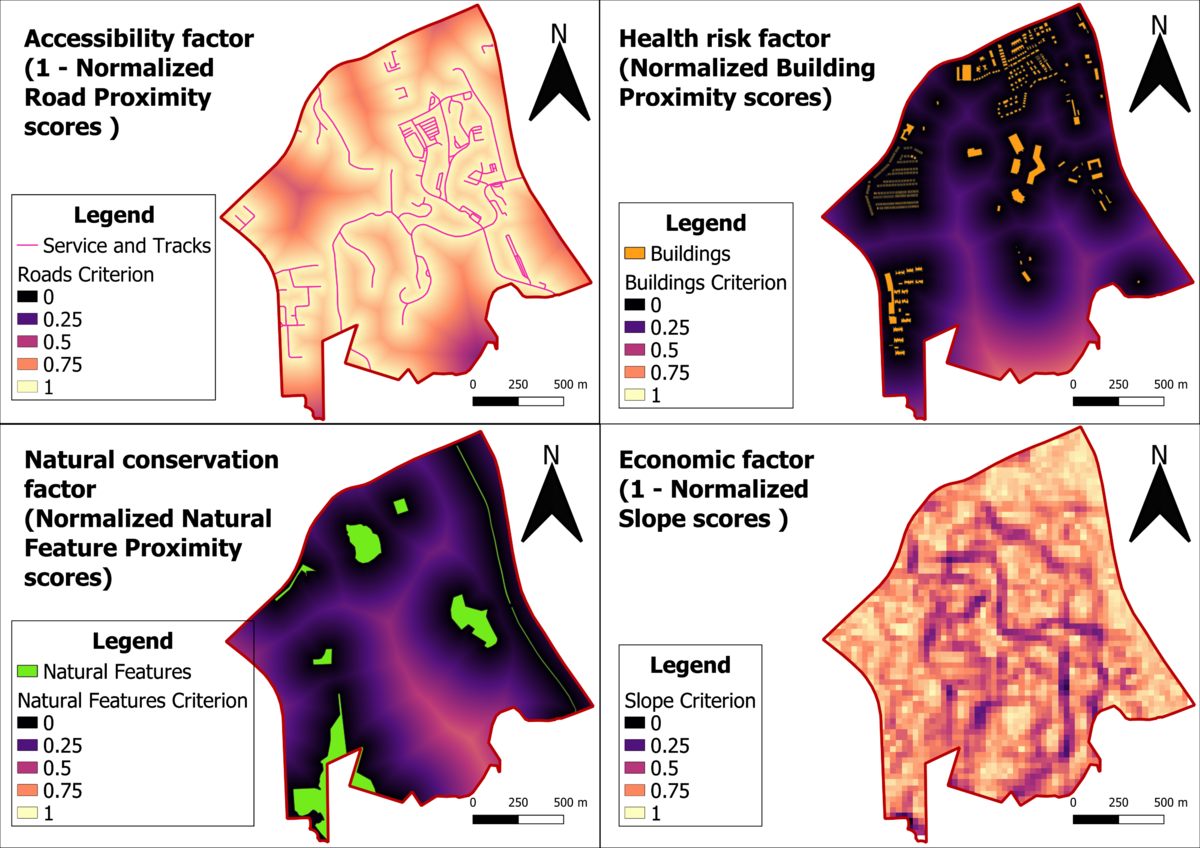
In determining the criterion scores of each factor, we must take note to standardise the colour codes where lighter regions of the map are more desirable.
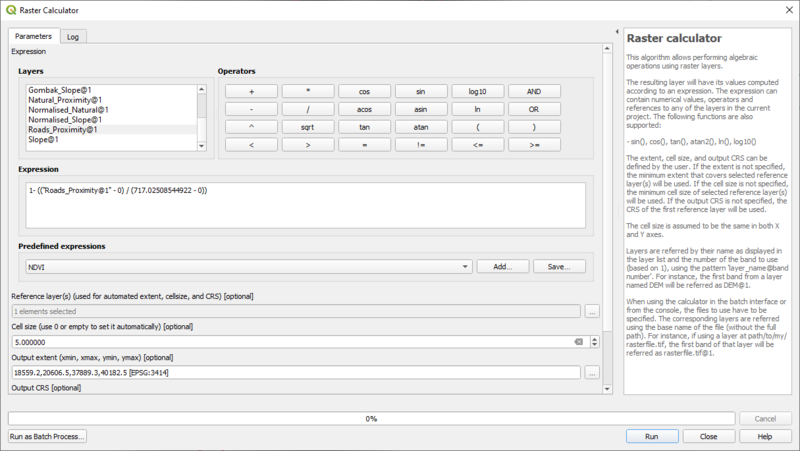
Accessibility: The closer proximity to the roads, the more desirable it is and thus a higher suitability score should be given. We inverse the normalised results using the formula below:
1 - Normalised results of the Road proximity
Health Risk: The further away from the buildings, the more desirable it is and thus a higher suitability score should be given. There is no need to inverse the normalised results.
Natural Conservation: The further away from the natural features, the more desirable it is and thus a higher suitability score should be given. There is no need to inverse the normalised results.
Slope Analysis: The less steep the slope, the more desirable it is and thus a higher suitability score should be given. We inverse the normalised results using the formula below:
1 - Normalised results of the slope analysis
Below is an example of normalisation using the raster calculator function is QGIS.
Accessibility Score
As evident from the accessibility factor map, we observe that there are many white areas due to the dense road network consisting of service and track lines. We note that there is a concentrated dark area in the South East portion of the map due to a lack of roads in that region.
Health Risk Score
As evident from the health risk factor map, a large proportion of the map is dark, due to the dense residential and military buildings present in Gombak. In the south edges of Gombak, lighter colours can be seen which denotes that the area is more suitable for building the Quarantine Site.
Natural Conservation Score
Due to the natural features concentrated around the North, East and West areas of Gombak, the map is largely dark. However, there is a light coloured line running from the South to Center of Gombak which is suitable for building the Quarantine Center as it is far away from natural features.
Economic Score
Despite Gombak having high digital elevation in the center of the map, there are not many steep slopes which results in a large proportion of the map being lighter coloured. Dark lines in the map denote steep slopes and are mainly found in the center of Gombak.
Analytical Hierarchical Process input matrix and result report

Using the template from SCBUK, we are able to produce the weightings for each factor to derive the combined suitability map.
The AHP matrix is used to generate the results report by calculating the relative importance of each factor. By doing a pairwise comparison, relatively more important factors will have a larger value, whereas relatively less important factors will have a lower value.
The order of importance of the factors is as below:
1. Health risk factor
2. Accessibility factor
3. Natural Conservation factor
4. Economic factor
The health risk factor is the most important because if the Quarantine Center is not placed sufficiently far enough from the population, there is high risk of spreading the disease which is extremely undesirable. It over-weighs the other factors due to the high health risks involved.
I ranked accessibility to be the next important factor as the close proximity to roads will provide greater convenience to building the site. This allows the site to be constructed quickly and efficiently so that it can be put to use faster and isolate people with the disease.
The natural conservation factor and economic factor are relatively unimportant as the core objective of building the Quarantine Center is to isolate the patients. It is relatively unimportant to consider the costs and to preserve nature when the general health of the population is at stake.
The resultant weights generated is as follows:
1. Health risk factor: 0.542
2. Accessibility factor: 0.314
3. Natural Conservation factor: 0.091
4. Economic factor: 0.053
The weights generated are consistent to the AHP model as shown by the 1% consistency check score generated, which means that we can use these weights for further analysis.
Combined Suitability Analysis
We generate the combined scoring map using the following in formula in raster calculator:
(BuildingSuitability * 0.542) + (Natural Feature Suitability * 0.091) + (Road Suitability * 0.314) + (Slope Suitablity * 0.053)
Using the weights from generated from the AHP, we are able to derive the combined suitability map.
Lighter areas in the map denote more suitable areas for the Quarantine Center. As we discussed early, there is a higher chance that the site is built in the South regions of Gombak. This combined suitability map confirms our prediction as there is a high concentration of light areas located at the Southern edges of Gombak.
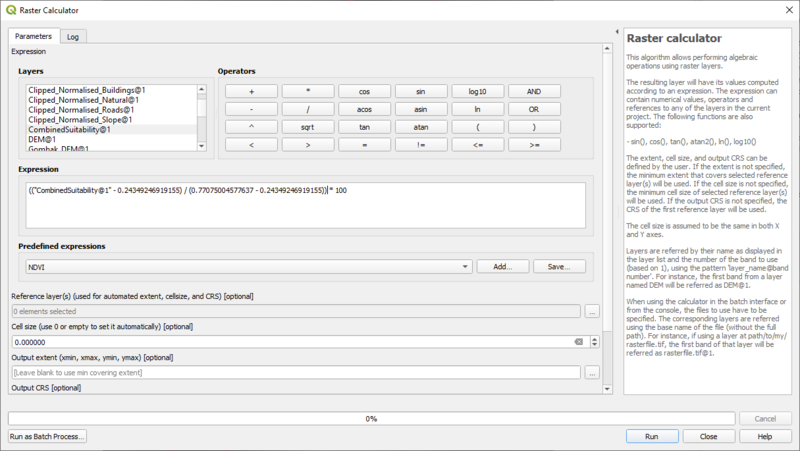
To improve the intuitiveness of analysis the combined suitability map, we reclassify the map into percentage using the formula shown in the screenshot below. We use the normalisation method again to standardise the scoring into percentage. The formula used is as below:
((Combined Suitability - Min(Suitability) / (Max(Suitability) - Min(Suitability)) * 100
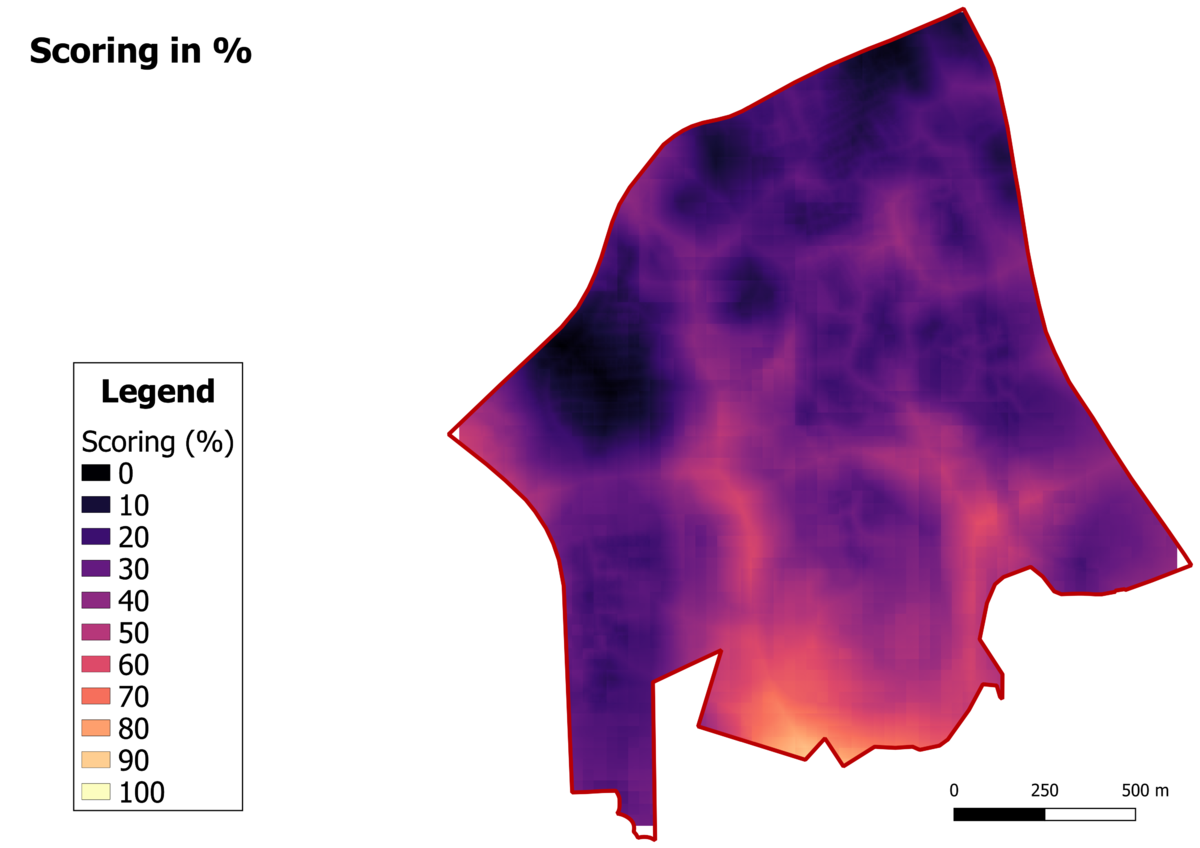
We observe that the southern tip of Gombak has the lightest colour, which translates into the highest suitability for building the Quarantine Center.
Next, we will then filter our the area with high suitability scores to identify the best areas to build the Quarantine Center.
Suggested location for the National Communicable Disease Quarantine Centre
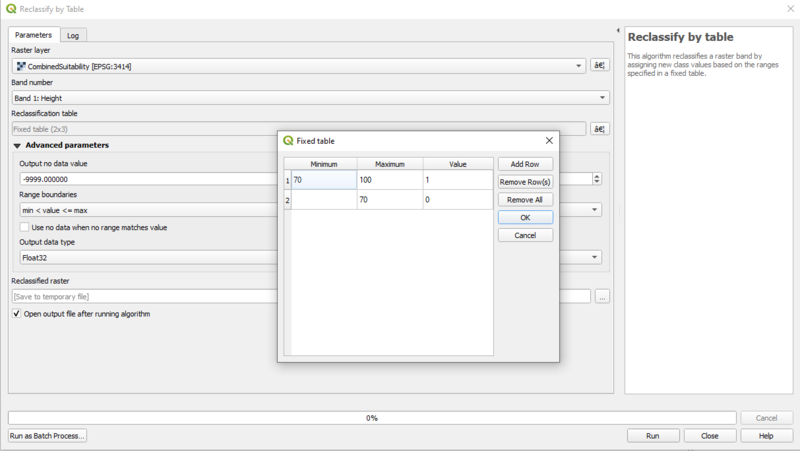
Using the "Reclassify by table" function, we categorise the area into 2 categories, one with suitability scores of above 70% and one with suitability scores of 70% and below. This gives us the resultant map as shown below.
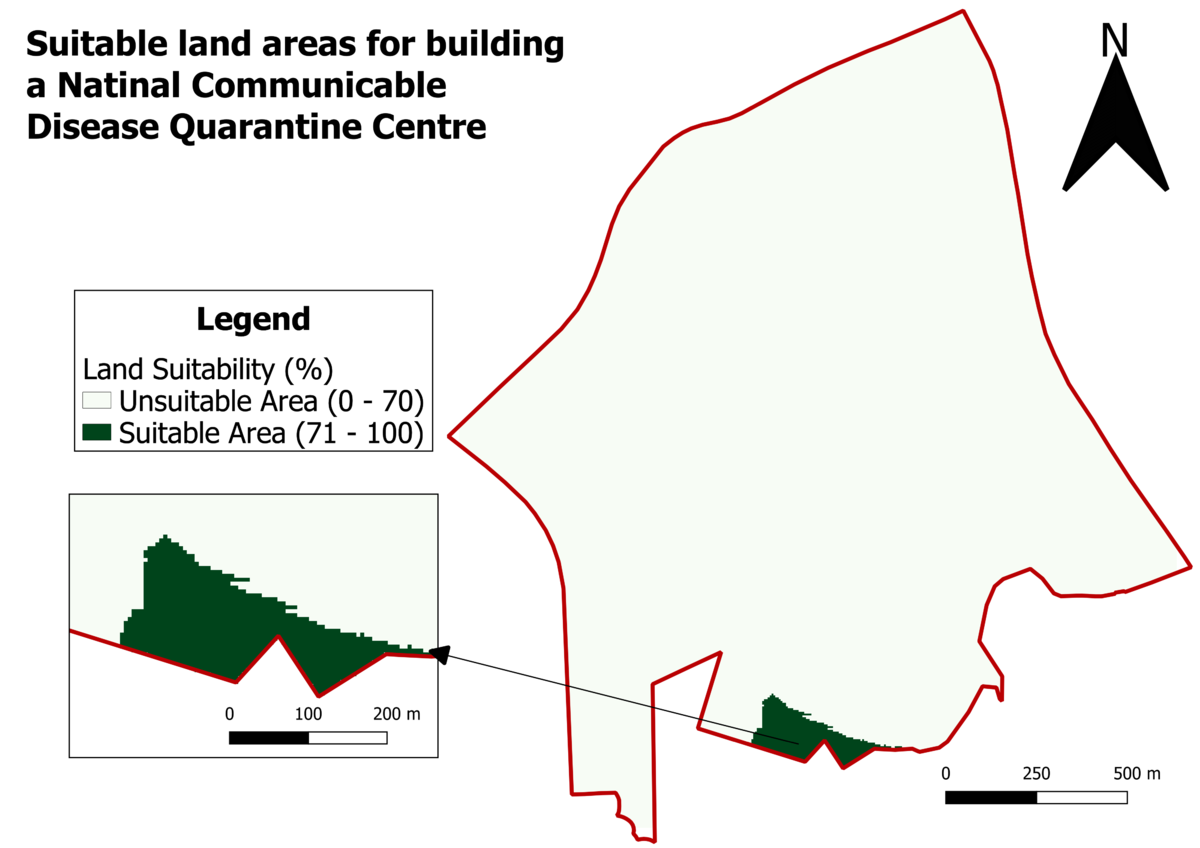
Using the above map, we are able to identify the most suitable area to place the Quarantine Center.
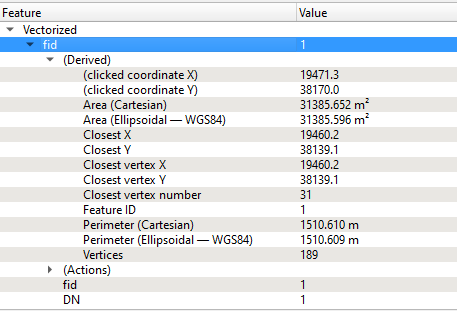
Using the "Raster to Vector" function, we are able to derive the area of the site, which is 31,385m2.
From this analysis, we are able to identify the most suitable site to build the Quarantine Center with a contiguous area of 10,00m^2 within the Gombak subzone. However, limitations to this study include the assumption that no population exists outside the Southern edge of Gombak where we suggest the Quarantine Center to be placed.
Limitation and future plans
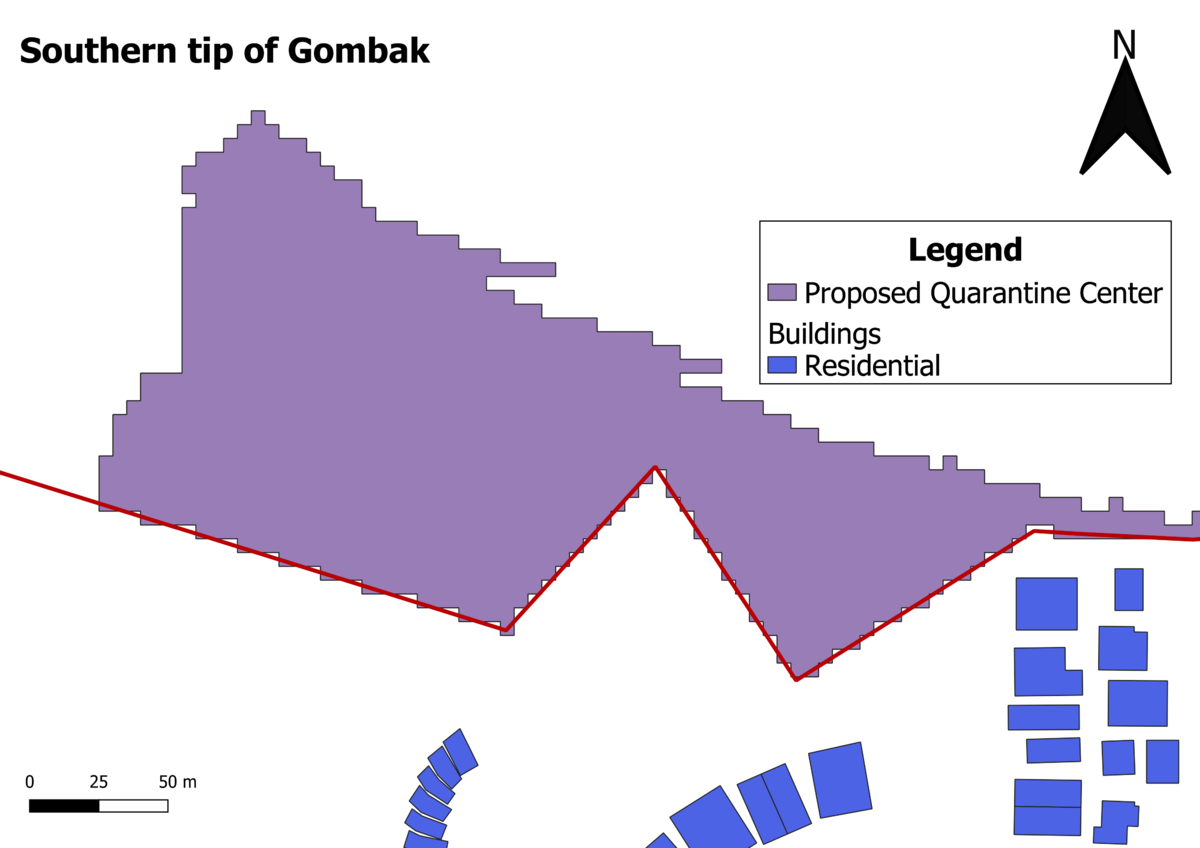
Upon exploring outside the Gombak subzone, we find that there is a concentrated cluster of residential buildings right outside the southern tip of Gombak belonging to another subzone. This will change our recommendation of placing the Quarantine Center at the suggested location as it will pose serious health risks to the population living right outside the Gombak subzone. This study of the Quarantine Center site recommendation shows that it is essential to consider all subzones when building new features especially when there are many factors affecting the recommendation. In cases where detrimental effects can result if the site is not chosen correctly, the population will suffer. Therefore we learn that the job of a urban city planner is not easy due to the complex decisions and factors that have to be considered.
In order to choose the best building site of the Quarantine Center within Gombak,there is a need to analyse areas outside Gombak as well to ensure that thorough analysis of factors are done.
