Difference between revisions of "SMT201 AY2019-20T1 EX2 Lee Yuan Kang"
Yklee.2017 (talk | contribs) |
Yklee.2017 (talk | contribs) |
||
| (22 intermediate revisions by the same user not shown) | |||
| Line 6: | Line 6: | ||
*the study area and the target roads, | *the study area and the target roads, | ||
*the study area and buildings, | *the study area and buildings, | ||
| − | *the study area and the | + | *the study area and the natural areas, |
*the study area and digital elevation | *the study area and digital elevation | ||
| + | |||
| + | The Gombak Subzone Planning is derived by using the attribute tables and select "Gombak". The subsequence road network, building and natural areas are all being done using the clipped function and export into separate layer. | ||
| + | |||
| + | === Map view with Roads === | ||
| + | There are many types of road in Gombak Subzone, I have filtered out the service and track roads for accessibility. Comparing the two types of roads, there are more service type roads than track types roads. | ||
| + | |||
| + | === Map view with Buildings === | ||
| + | There are different types of building in Gombak subzone. However, majority of the building types are null value hence I did not split based on types as the null types will not value add to any analysis. | ||
| + | |||
| + | === Map view with Natural Areas === | ||
| + | There are different types of natural areas and I have split them into their types, they are forests, parks and water. | ||
| + | |||
| + | === Map view with Digital Elevation === | ||
| + | I have splitted the Elevation to 5 classes The steeper the class is the more we should avoid it as the development cost will be higher. | ||
| + | |||
| + | == Gombak Subzone Area (Proximity) == | ||
| + | |||
| + | [[File:Proximity yk.png|frameless|center|800px]] | ||
| + | |||
| + | === Proximity with Roads === | ||
| + | I have split the raster into 5 classes in quantile, the nearer the road, the better it is, which also means more accessible. Hence the colour white will be representing a more suitable development decision. The furthest distance of the road is 721.773170837402 which represent as the most inaccessible. | ||
| + | |||
| + | === Proximity with Buildings === | ||
| + | Similarly, the raster has been split into 5 classes, the further the building is the better it is for the health risk factor. The furthest building is 825.793009277344. The redder it appears on the map, it means the further the distance is. One the other hand, if the tone of the colour is near white with a pinkish tone, it will mean the distance is 0. | ||
| + | |||
| + | === Proximity with Natural Areas === | ||
| + | Similarly, the raster has been split into 5 classes again, the further the natural areas are, the better it is for conservation purpose. The furthest distance natural area is 862.805825134277 and it is represented by the darker green. The darker the green is, the further it is. | ||
| + | |||
| + | === Slope === | ||
| + | Again, the slope is split into 5 classes, and it will measure the steepness of the slope. The blue will mean it is steeper and the red will mean it is least steep. The range of the degree of steepness is from 0 to 36.3943401031494, 0 represented by red and 36.3943401031494 represented by the blue and that is the steepest slope in Gombak Area. | ||
| + | |||
| + | == Gombak Subzone Area (Criterion Scores) == | ||
| + | [[File:Criteria yk.png|frameless|center|800px]] | ||
| + | |||
| + | For all the standardization I have deployed the formula of X = (X - Xmin)/(Xmax - Xmin) | ||
| + | |||
| + | === Criterion Score for Roads === | ||
| + | (""Proxi_roads@1" - 0) / (0 - 721.773170837402) | ||
| + | |||
| + | === Criterion Score for Buildings=== | ||
| + | ("Proxi_buildings@1" - 0) / (825.793009277344- 0) | ||
| + | |||
| + | === Criterion Score for Natural Areas=== | ||
| + | ("Proxi_natural@1" - 0) / (862.805825134277- 0) | ||
| + | |||
| + | === Criterion Score for Slope === | ||
| + | ("slope@1" - 0) / (0 - 36.3943401031494 ) | ||
| + | |||
| + | == Analytical Hierarchical Process (AHP) input matrix == | ||
| + | |||
| + | === Excel Screenshot === | ||
| + | [[File:Yk excel1.png|left|600px]] | ||
| + | [[File:Yk excel2.png|centre|600px]] | ||
| + | |||
| + | === Explanation for selection === | ||
| + | There are 4 criteria to select, they are mainly Health Risk, Natural Area, Accessibility and Economic factors. | ||
| + | I have ranked as the criteria as below: | ||
| + | 1) Health Risk | ||
| + | 2) Economic | ||
| + | 3) Accessibility | ||
| + | 4) Natural Area | ||
| + | |||
| + | The Health risk to me will be the most important because the buildings must be at a certain distance away to prevent the spread of disease. | ||
| + | The next factor will be Economic because to build a quarantine centre, it should be build on a gentle ground and not steep ground to reduce development cost | ||
| + | Following Factor will be Accessibility where I will think it is less important than cost but will be a good to have if it is accessible. | ||
| + | The last factor will be natural area. It will be good if we can retain them, but at times if we need to develope the quarantine centre to prevent the disease from spreading, we might need to sacrifise the natural area for greater purpose. | ||
| + | |||
| + | |||
| + | == Gombak Subzone Area (Suitable Area) == | ||
| + | |||
| + | [[File:Suitability area yk.png|frameless|center|800px]] | ||
| + | [[File:Suitability attribute table yk.png|frameless|center|800px]] | ||
| + | |||
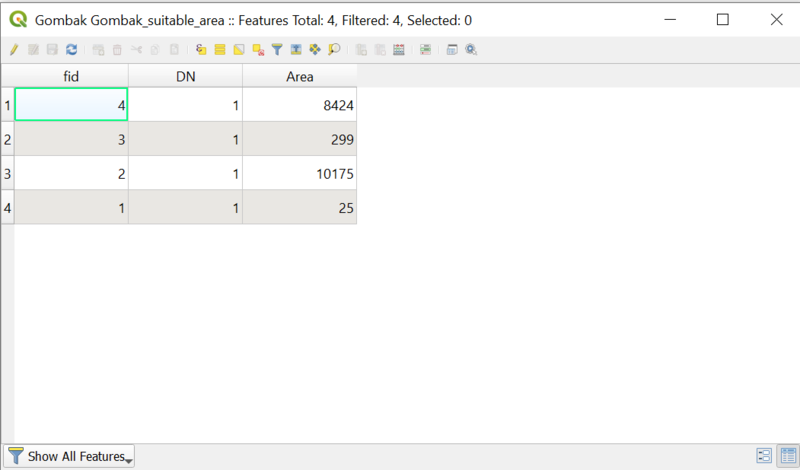
| + | Based on the requirement given, the area that is deemed as suitable should be at least 10,000m^2. Therefore, according to the map, there is an area that is more slightly more than 10,000m^2. The area is being derived by converting the raster to vector. Then after the the vector has been derived, I clipped the polygon with Gombak Subzone area and that will give me the area that might be suitable within Gombak area. To get the area to check if its really above 10,000 m^2, I created a new calculated fields in the atrribute table as shown above by using $area. | ||
Latest revision as of 23:21, 10 November 2019
Contents
Gombak Subzone Area
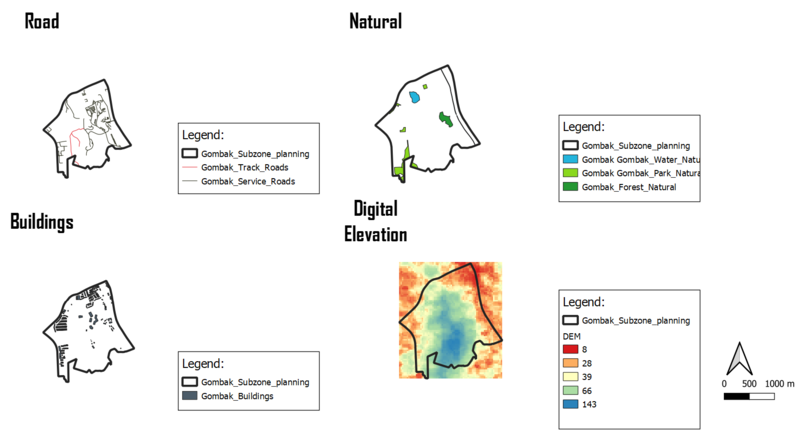
The image above shows the 4 different views of Gombak study area.
- the study area and the target roads,
- the study area and buildings,
- the study area and the natural areas,
- the study area and digital elevation
The Gombak Subzone Planning is derived by using the attribute tables and select "Gombak". The subsequence road network, building and natural areas are all being done using the clipped function and export into separate layer.
Map view with Roads
There are many types of road in Gombak Subzone, I have filtered out the service and track roads for accessibility. Comparing the two types of roads, there are more service type roads than track types roads.
Map view with Buildings
There are different types of building in Gombak subzone. However, majority of the building types are null value hence I did not split based on types as the null types will not value add to any analysis.
Map view with Natural Areas
There are different types of natural areas and I have split them into their types, they are forests, parks and water.
Map view with Digital Elevation
I have splitted the Elevation to 5 classes The steeper the class is the more we should avoid it as the development cost will be higher.
Gombak Subzone Area (Proximity)
Proximity with Roads
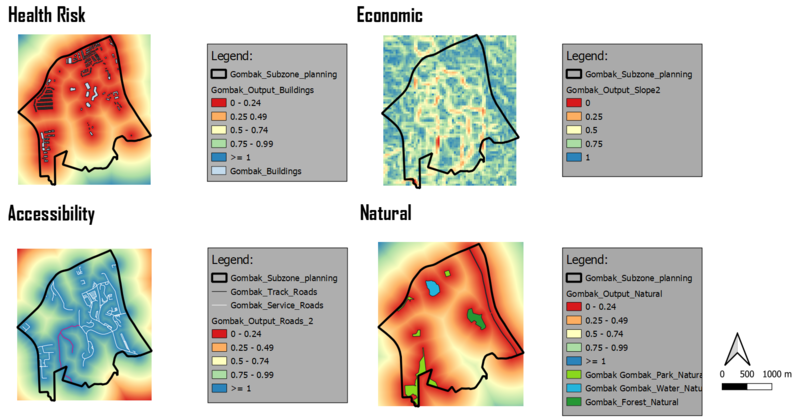
I have split the raster into 5 classes in quantile, the nearer the road, the better it is, which also means more accessible. Hence the colour white will be representing a more suitable development decision. The furthest distance of the road is 721.773170837402 which represent as the most inaccessible.
Proximity with Buildings
Similarly, the raster has been split into 5 classes, the further the building is the better it is for the health risk factor. The furthest building is 825.793009277344. The redder it appears on the map, it means the further the distance is. One the other hand, if the tone of the colour is near white with a pinkish tone, it will mean the distance is 0.
Proximity with Natural Areas
Similarly, the raster has been split into 5 classes again, the further the natural areas are, the better it is for conservation purpose. The furthest distance natural area is 862.805825134277 and it is represented by the darker green. The darker the green is, the further it is.
Slope
Again, the slope is split into 5 classes, and it will measure the steepness of the slope. The blue will mean it is steeper and the red will mean it is least steep. The range of the degree of steepness is from 0 to 36.3943401031494, 0 represented by red and 36.3943401031494 represented by the blue and that is the steepest slope in Gombak Area.
Gombak Subzone Area (Criterion Scores)
For all the standardization I have deployed the formula of X = (X - Xmin)/(Xmax - Xmin)
Criterion Score for Roads
(""Proxi_roads@1" - 0) / (0 - 721.773170837402)
Criterion Score for Buildings
("Proxi_buildings@1" - 0) / (825.793009277344- 0)
Criterion Score for Natural Areas
("Proxi_natural@1" - 0) / (862.805825134277- 0)
Criterion Score for Slope
("slope@1" - 0) / (0 - 36.3943401031494 )
Analytical Hierarchical Process (AHP) input matrix
Excel Screenshot
Explanation for selection
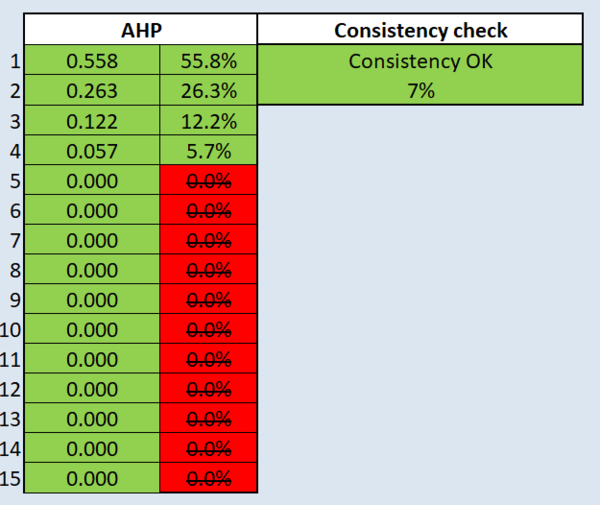
There are 4 criteria to select, they are mainly Health Risk, Natural Area, Accessibility and Economic factors. I have ranked as the criteria as below: 1) Health Risk 2) Economic 3) Accessibility 4) Natural Area
The Health risk to me will be the most important because the buildings must be at a certain distance away to prevent the spread of disease. The next factor will be Economic because to build a quarantine centre, it should be build on a gentle ground and not steep ground to reduce development cost Following Factor will be Accessibility where I will think it is less important than cost but will be a good to have if it is accessible. The last factor will be natural area. It will be good if we can retain them, but at times if we need to develope the quarantine centre to prevent the disease from spreading, we might need to sacrifise the natural area for greater purpose.
Gombak Subzone Area (Suitable Area)
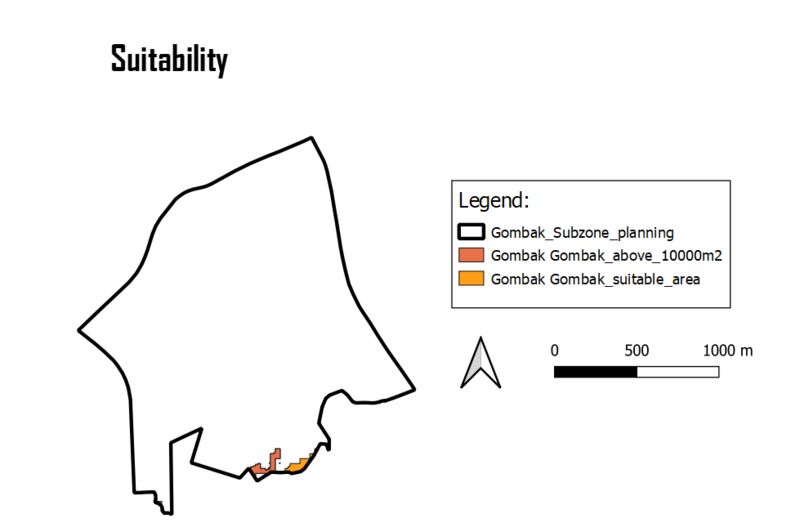
Based on the requirement given, the area that is deemed as suitable should be at least 10,000m^2. Therefore, according to the map, there is an area that is more slightly more than 10,000m^2. The area is being derived by converting the raster to vector. Then after the the vector has been derived, I clipped the polygon with Gombak Subzone area and that will give me the area that might be suitable within Gombak area. To get the area to check if its really above 10,000 m^2, I created a new calculated fields in the atrribute table as shown above by using $area.
