Difference between revisions of "SMT201 AY2019-20T1 EX2 Nicole Ng Linn"
| (12 intermediate revisions by the same user not shown) | |||
| Line 1: | Line 1: | ||
== Map Layout with 4 Decision Factors == | == Map Layout with 4 Decision Factors == | ||
[[File:Map1.jpg|frameless|center|Map Layout of Gombak and Factors|1000px]] | [[File:Map1.jpg|frameless|center|Map Layout of Gombak and Factors|1000px]] | ||
| + | Data Source: Master Plan 2014 Subzone Boundary (No Sea) (SHP) from URA.[https://data.gov.sg/dataset/master-plan-2014-subzone-boundary-no-sea]. Roads, Buildings and Natural (SHP) from OpenStreetMap.[https://download.bbbike.org/osm/bbbike/Singapore/]. ASTER Global Digital Elevation Model (GDEM) dataset (TIFF) jointly prepared by NASA and METI, Japan; raster dataset combined by Professor Kam Tin Seong.[https://search.earthdata.nasa.gov/search?m=-7.175!25.59375!1!1!0!0%2C2]. | ||
=== Gombak and Target Roads === | === Gombak and Target Roads === | ||
| Line 9: | Line 10: | ||
=== Gombak and Target Natural Features === | === Gombak and Target Natural Features === | ||
| − | The selected site should also be away from natural features, such as forests, parks and water bodies. There are 1 forest, 4 parks and 3 waterbodies identified. The forest is categorised in dark green on the map, while the parks and the water bodies are | + | The selected site should also be away from natural features, such as forests, parks and water bodies. There are 1 forest, 4 parks, and 3 waterbodies identified. The forest is categorised in dark green on the map, while the parks and the water bodies are categorized using light green and light blue respectively. |
=== Gombak and Digital Elevation === | === Gombak and Digital Elevation === | ||
| Line 18: | Line 19: | ||
[[File:Graph3.jpg|frameless|center|Map Layout of Gombak and Factors|1000px]] | [[File:Graph3.jpg|frameless|center|Map Layout of Gombak and Factors|1000px]] | ||
| + | Data Source: Master Plan 2014 Subzone Boundary (No Sea) (SHP) from URA.[https://data.gov.sg/dataset/master-plan-2014-subzone-boundary-no-sea]. Roads, Buildings and Natural (SHP) from OpenStreetMap.[https://download.bbbike.org/osm/bbbike/Singapore/]. ASTER Global Digital Elevation Model (GDEM) dataset (TIFF) jointly prepared by NASA and METI, Japan; raster dataset combined by Professor Kam Tin Seong.[https://search.earthdata.nasa.gov/search?m=-7.175!25.59375!1!1!0!0%2C2]. | ||
=== Gombak and Proximity to Target Roads Layer === | === Gombak and Proximity to Target Roads Layer === | ||
| Line 23: | Line 25: | ||
=== Gombak and Proximity to Buildings Layer === | === Gombak and Proximity to Buildings Layer === | ||
| − | The proximity from | + | The proximity from buildings to a piece of 5m^2 land varies from 0 to 826.62m. Land lots with lighter values have higher suitability to be chosen to build the quarantine center because these locations are further away from the population. All land lots with distance to the nearest building in Gombak of at least 100 meters are shown in black in the map above. |
=== Gombak and Proximity to Target Natural Features Layer === | === Gombak and Proximity to Target Natural Features Layer === | ||
| − | The proximity from | + | The proximity from natural conservations to a piece of 5m^2 land varies from 0 to 821.48m. Land lots that are further away from natural features have lighter values in the map, and they have higher suitability to be chosen to build the quarantine center. All land lots with distance to the nearest natural feature of at least 100 meters are shown in black in the map above. |
=== Gombak and Slope Layer === | === Gombak and Slope Layer === | ||
| Line 32: | Line 34: | ||
== Criterion Scores with 4 Decision Factors == | == Criterion Scores with 4 Decision Factors == | ||
| − | [[File: | + | [[File:Criterion-Score.jpg|frameless|center|Map Layout of Gombak and Factors|1000px]] |
| + | Data Source: Master Plan 2014 Subzone Boundary (No Sea) (SHP) from URA.[https://data.gov.sg/dataset/master-plan-2014-subzone-boundary-no-sea]. Roads, Buildings and Natural (SHP) from OpenStreetMap.[https://download.bbbike.org/osm/bbbike/Singapore/]. ASTER Global Digital Elevation Model (GDEM) dataset (TIFF) jointly prepared by NASA and METI, Japan; raster dataset combined by Professor Kam Tin Seong.[https://search.earthdata.nasa.gov/search?m=-7.175!25.59375!1!1!0!0%2C2]. | ||
| − | + | The Min-Max Criteria Standardization Technique was used for the proximity of raster layers. | |
| + | All standardized criteria scores range from 0-1. The higher the criterion score (ie the greener and bluer areas on the maps), the more suitable the plot of land is for the quarantine site for each respective layer. The following standardized criteria scores are elaborated below for each layer. | ||
| + | === Standardized Criterion Score for Road Layer === | ||
| + | Standardized Criterion Score = 1 - (Current proximity to respective feature - 0)/ (708.678344726563- 0). | ||
| + | As the selected site should be close to existing roads and with the initial min-max formula giving high value for sites further away from existing roads, the standardized criterion score should be as follows so that higher criterion scores indicate a more suitable plot of land. | ||
| − | === | + | === Standardized Criterion Score for Building Layer === |
| + | Standardized Criterion Score = (Current proximity to respective feature - 0)/ (826.61962890625- 0) | ||
| + | === Standardized Criterion Score for Natural Feature Layer === | ||
| + | Standardized Criterion Score = (Current proximity to respective feature - 0)/ (821.477355957031- 0) | ||
| − | === | + | === Standardized Criterion Score for Slope Layer === |
| + | Standardized Criterion Score = 1 - (Current Slope of respective feature - 0)/(36.4307708740234- 0). | ||
| + | As the selected site should be a slope that is as gentle as possible and with the initial min-max formula giving high value for sites at steeper slopes, the standardized criterion score should be as follows so that higher criterion scores indicate a more suitable plot of land. | ||
| − | === | + | == AHP Scoring Matrix == |
| + | [[File:AHP-Nicole.png|frameless|center|Map Layout of Gombak and Factors|1000px]] | ||
| + | |||
| + | === HP Pairwise Comparison & Scores === | ||
| + | The order of importance in descending order is as follows: Health Risk factor > Economic factor > Accessibility factor > Nature Conservation factor. | ||
| + | The fact that a quarantined site has to be built to isolate those with diseases from the rest of the healthy population goes to show that the health risk factor whereby the selected site should be away from population in order to avoid disease spreading to the nearby population is the most important. | ||
| + | This is to ensure least casualties as possible which could in order to reduce resources and economic spending to treat the diseases, which is why health risk factor is ranked the most important. | ||
| + | Using the previous normalised results, the AHP scoring are as follows: | ||
| − | + | # Economic Factor: 0.272 | |
| − | + | # Accessibility Factor: 0.131 | |
| − | + | # Healthcare Factor: 0.540 | |
| − | + | # Natural Conservation Factor: 0.057 | |
| − | |||
| − | |||
| − | |||
| − | |||
| + | The higher the AHP score, the more important the factor is. The AHP scores will be used in the next section to determine the suitable plots of land for the quarantine center. The consistency check is 7% which is below 10%, showing that the AHP scoring can be used | ||
| − | == | + | == The Suitability Land Lot(s) == |
| + | After running the Raster Calculator to obtain the Raster for Suitability. I’ve identified 4 potential plots to be considered for choosing. | ||
| + | [[File:Table.png|frameless|center|Map Layout of Gombak and Factors|600px]] | ||
| + | |||
| + | Next, I used the Raster Analysis to Reclassify by Table to show a binary of Suitable and Not Suitable. Any raster pixel that was able to obtain >= 0.5 in terms of the standardised score will be labeled as a suitable pixel. | ||
| + | |||
| + | [[File:SustainabilityLandLots.jpg|frameless|center|Map Layout of Gombak and Factors|1000px]] | ||
| + | These were the results I obtained after choosing what is the suitable value to consider. It seems like all 4 plots of land were still suitable for consideration. I then decided to Vectorize the raster to find out the area of these plots. | ||
| + | |||
| + | # Suitable Land Lot 1 - 123362.77229626328 m^2 | ||
| + | # Suitable Land Lot 2 - 58183.823024439414 m^2 | ||
| + | # Suitable Land Lot 3 - 6485.156405102867 m^2 | ||
| + | # Suitable Land Lot 4 - 18588.663978911747 m^2 | ||
| + | |||
| + | In this plot, Suitable Land Lot 1 is the best option. | ||
Latest revision as of 14:06, 9 November 2019
Contents
Map Layout with 4 Decision Factors
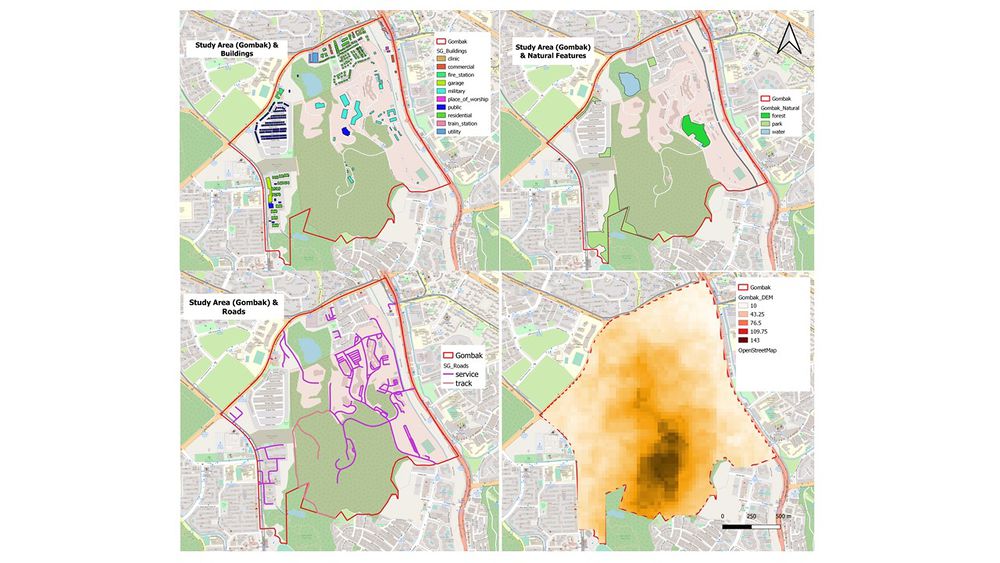
Data Source: Master Plan 2014 Subzone Boundary (No Sea) (SHP) from URA.[1]. Roads, Buildings and Natural (SHP) from OpenStreetMap.[2]. ASTER Global Digital Elevation Model (GDEM) dataset (TIFF) jointly prepared by NASA and METI, Japan; raster dataset combined by Professor Kam Tin Seong.[3].
Gombak and Target Roads
The selected site should be close to local roads to ensure easy transportation of building materials during the construction stage. The roads are shown in a line vector and are categorized into service roads and tracks, which are shown using thicker strokes. The service roads spread across most of the Gombak planning subzone mostly located in the North-East region whereas the tracks are located in the Central region of Gombak and connecting to other roads in the South of Gombak.
Gombak and Buildings
The selected site should be away from the population to prevent diseases from spreading to the public. Out of the 527 buildings identified in Gombak, 505 buildings are of "unknown" type in the data provided. Hence, some changes to categorize the buildings were made based on their type from the OpenStreetMap. All buildings are treated as population indicators, and the selected site should be away from the buildings.
Gombak and Target Natural Features
The selected site should also be away from natural features, such as forests, parks and water bodies. There are 1 forest, 4 parks, and 3 waterbodies identified. The forest is categorised in dark green on the map, while the parks and the water bodies are categorized using light green and light blue respectively.
Gombak and Digital Elevation
Finally, the selected site should avoid steep slopes to reduce the development costs for cut-and-fill construction techniques. The lowest point in Gombak is 10 meters above sea level, depicted in beige. The Southern region of Gombak has the highest elevation with 143 meters above sea level, depicted in dark brown. Only around 2% of the buildings and 5% of the local roads in Gombak are located in the region with the highest elevation. All the natural features are located within the low-lying areas of Gombak.
Map Layout with Proximity to 3 Decision Factors and Slope Layer
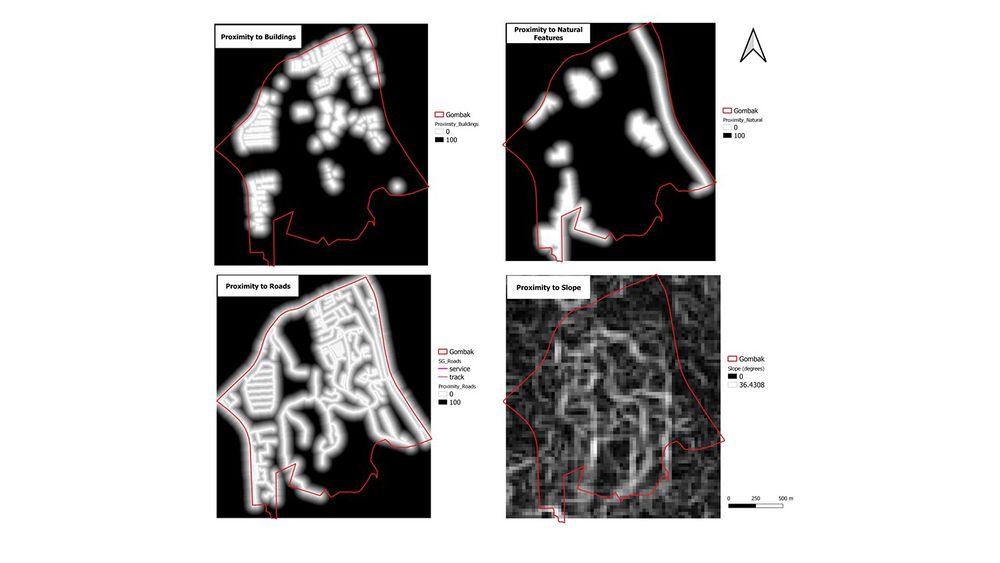
To select a suitable site, a proximity analysis is needed to show the closeness of all land lots in Gombak to the identified features of interest. In general, darker values in the maps below depict higher closeness to the features of interest, and lighter values depict lower closeness.
Data Source: Master Plan 2014 Subzone Boundary (No Sea) (SHP) from URA.[4]. Roads, Buildings and Natural (SHP) from OpenStreetMap.[5]. ASTER Global Digital Elevation Model (GDEM) dataset (TIFF) jointly prepared by NASA and METI, Japan; raster dataset combined by Professor Kam Tin Seong.[6].
Gombak and Proximity to Target Roads Layer
The proximity from roads to a piece of 5m^2 land varies from 0 to 708.68m. As the selected sites should be closer to existing local roads. In the map above, all land lots with distance to the nearest road of at least 100 meters are shown in black.
Gombak and Proximity to Buildings Layer
The proximity from buildings to a piece of 5m^2 land varies from 0 to 826.62m. Land lots with lighter values have higher suitability to be chosen to build the quarantine center because these locations are further away from the population. All land lots with distance to the nearest building in Gombak of at least 100 meters are shown in black in the map above.
Gombak and Proximity to Target Natural Features Layer
The proximity from natural conservations to a piece of 5m^2 land varies from 0 to 821.48m. Land lots that are further away from natural features have lighter values in the map, and they have higher suitability to be chosen to build the quarantine center. All land lots with distance to the nearest natural feature of at least 100 meters are shown in black in the map above.
Gombak and Slope Layer
Slopes are calculated using proximity to elevation. The slope steepness varies from 0 to 36.43 degrees. The selected site should avoid steep slope and hence the black shaded regions should be taken into consideration. As seen from the map, most of the land lots in Gombak are flat, despite the rather uneven elevation in the region.
Criterion Scores with 4 Decision Factors
Data Source: Master Plan 2014 Subzone Boundary (No Sea) (SHP) from URA.[7]. Roads, Buildings and Natural (SHP) from OpenStreetMap.[8]. ASTER Global Digital Elevation Model (GDEM) dataset (TIFF) jointly prepared by NASA and METI, Japan; raster dataset combined by Professor Kam Tin Seong.[9].
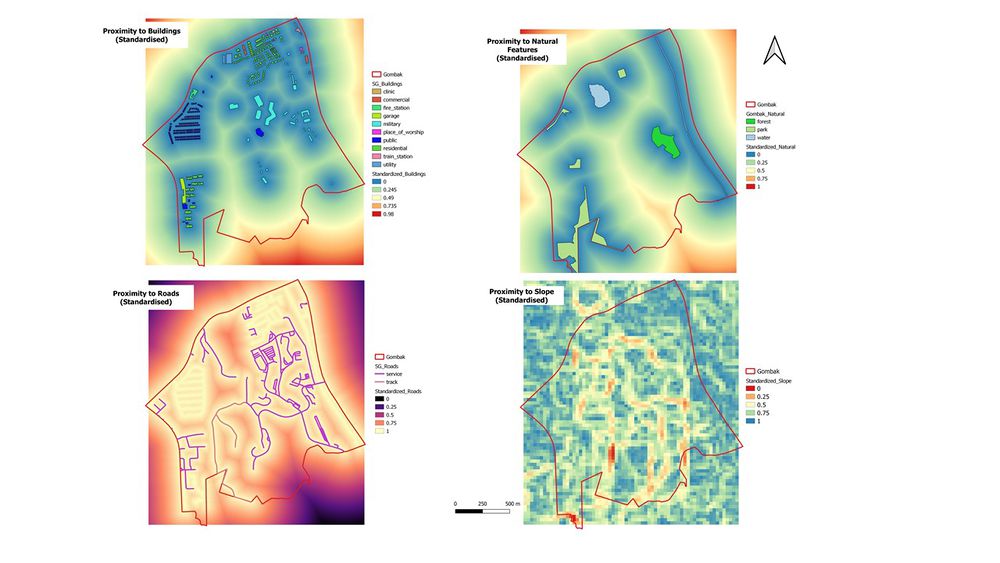
The Min-Max Criteria Standardization Technique was used for the proximity of raster layers. All standardized criteria scores range from 0-1. The higher the criterion score (ie the greener and bluer areas on the maps), the more suitable the plot of land is for the quarantine site for each respective layer. The following standardized criteria scores are elaborated below for each layer.
Standardized Criterion Score for Road Layer
Standardized Criterion Score = 1 - (Current proximity to respective feature - 0)/ (708.678344726563- 0). As the selected site should be close to existing roads and with the initial min-max formula giving high value for sites further away from existing roads, the standardized criterion score should be as follows so that higher criterion scores indicate a more suitable plot of land.
Standardized Criterion Score for Building Layer
Standardized Criterion Score = (Current proximity to respective feature - 0)/ (826.61962890625- 0)
Standardized Criterion Score for Natural Feature Layer
Standardized Criterion Score = (Current proximity to respective feature - 0)/ (821.477355957031- 0)
Standardized Criterion Score for Slope Layer
Standardized Criterion Score = 1 - (Current Slope of respective feature - 0)/(36.4307708740234- 0). As the selected site should be a slope that is as gentle as possible and with the initial min-max formula giving high value for sites at steeper slopes, the standardized criterion score should be as follows so that higher criterion scores indicate a more suitable plot of land.
AHP Scoring Matrix
HP Pairwise Comparison & Scores
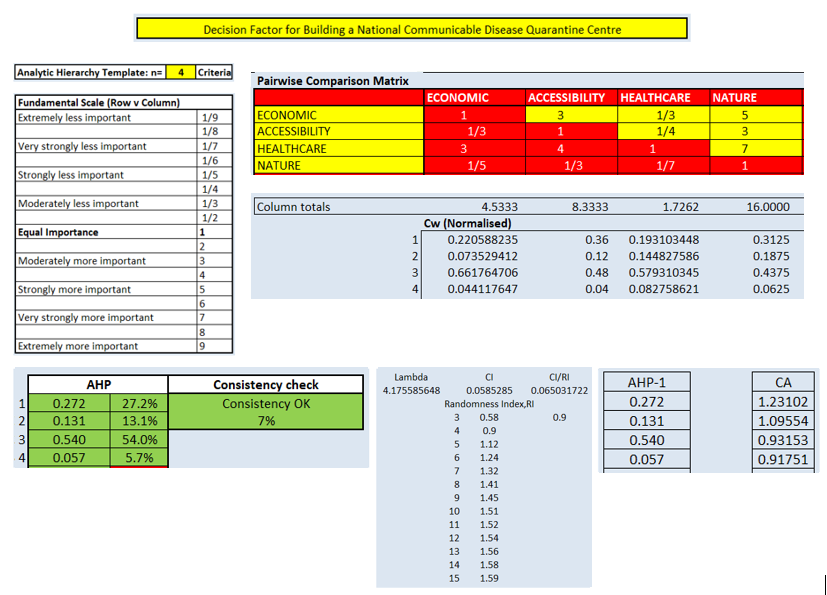
The order of importance in descending order is as follows: Health Risk factor > Economic factor > Accessibility factor > Nature Conservation factor. The fact that a quarantined site has to be built to isolate those with diseases from the rest of the healthy population goes to show that the health risk factor whereby the selected site should be away from population in order to avoid disease spreading to the nearby population is the most important. This is to ensure least casualties as possible which could in order to reduce resources and economic spending to treat the diseases, which is why health risk factor is ranked the most important.
Using the previous normalised results, the AHP scoring are as follows:
- Economic Factor: 0.272
- Accessibility Factor: 0.131
- Healthcare Factor: 0.540
- Natural Conservation Factor: 0.057
The higher the AHP score, the more important the factor is. The AHP scores will be used in the next section to determine the suitable plots of land for the quarantine center. The consistency check is 7% which is below 10%, showing that the AHP scoring can be used
The Suitability Land Lot(s)
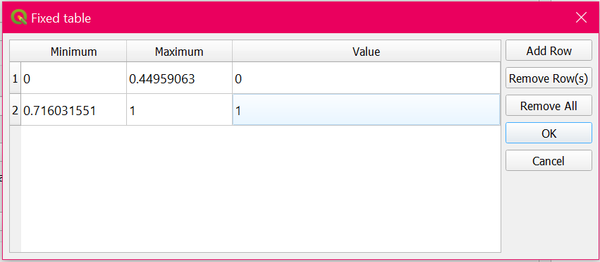
After running the Raster Calculator to obtain the Raster for Suitability. I’ve identified 4 potential plots to be considered for choosing.
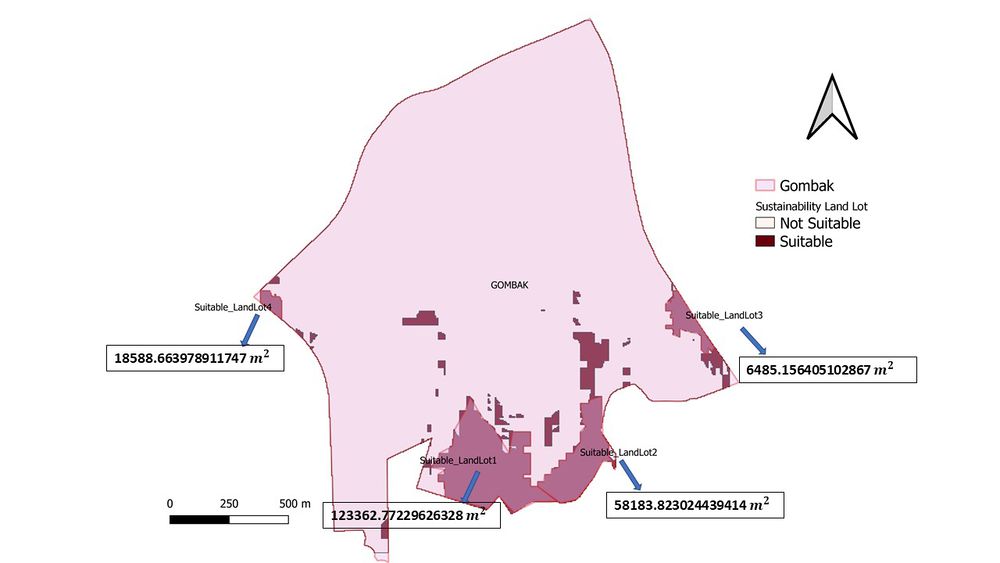
Next, I used the Raster Analysis to Reclassify by Table to show a binary of Suitable and Not Suitable. Any raster pixel that was able to obtain >= 0.5 in terms of the standardised score will be labeled as a suitable pixel.
These were the results I obtained after choosing what is the suitable value to consider. It seems like all 4 plots of land were still suitable for consideration. I then decided to Vectorize the raster to find out the area of these plots.
- Suitable Land Lot 1 - 123362.77229626328 m^2
- Suitable Land Lot 2 - 58183.823024439414 m^2
- Suitable Land Lot 3 - 6485.156405102867 m^2
- Suitable Land Lot 4 - 18588.663978911747 m^2
In this plot, Suitable Land Lot 1 is the best option.
