Difference between revisions of "G2-Group05-Proposal"
| (13 intermediate revisions by 3 users not shown) | |||
| Line 26: | Line 26: | ||
</center> | </center> | ||
<!-- Nav Bar --> | <!-- Nav Bar --> | ||
| − | |||
<!--body--> | <!--body--> | ||
| − | <center><div style="background: rgb(216, 187, 106); padding: 10px; font-weight: bold; font-family: | + | <center><div style="background: rgb(216, 187, 106); padding: 10px; font-weight: bold; font-family: Trebuchet MS; |
line-height: 1em; text-indent: 15px; text-align: center; font-size: 30px"> | line-height: 1em; text-indent: 15px; text-align: center; font-size: 30px"> | ||
<font color="FFFFFF">Project Proposal</font></div></center> | <font color="FFFFFF">Project Proposal</font></div></center> | ||
<br> | <br> | ||
| − | ==<div style="background: rgb(226, 113, 113); padding: 10px; font-weight: bold; font-family: | + | ==<div style="background: rgb(226, 113, 113); padding: 10px; font-weight: bold; font-family: Trebuchet MS; line-height: 1em; text-align: center; |
border-left: #BEB9B5 solid 32px; font-size: 20px"><font color="white">About Pingtung County and Kaohsiung City</font></div>== | border-left: #BEB9B5 solid 32px; font-size: 20px"><font color="white">About Pingtung County and Kaohsiung City</font></div>== | ||
| − | <div style="border-left:rgb(226, 113, 113) solid 15px; padding: 0px 30px 0px 20px;"> | + | <div style="border-left: #BEB9B5 solid 15px; padding: 0px 30px 0px 20px;"> |
| + | |||
| + | <div style="width: 100%;"><font size=3px; face="Open Sans, Arial, sans-serif" text-align:justify;> | ||
| + | |||
| + | Pingtung is the southernmost and fifth-largest county of Taiwan. It is well known for its agriculture, producing sugarcane, rice, bananas tobaccos and fruits. Top attractions in Pingtung include Kenting National Park, Eluanbi Park, and Hengchun Old Town. | ||
| + | |||
| + | Kaohsiung City is the second-largest city in Taiwan and one of the largest ports in the world. A thriving international metropolis at the southern tip of Taiwan, Kaohsiung is home to several popular attraction sites such as Love River, Lotus Pond, and Qijin. | ||
| + | |||
| + | </font></div></div> | ||
| + | |||
| + | ==<div style="background: rgb(226, 113, 113); padding: 10px; font-weight: bold; font-family: Trebuchet MS; line-height: 1em; text-align: center; | ||
| + | border-left: #BEB9B5 solid 32px; font-size: 20px"><font color="white">Project Motivation</font></div>== | ||
| + | |||
| + | <div style="border-left: #BEB9B5 solid 15px; padding: 0px 30px 0px 20px;"> | ||
| + | |||
| + | <div style="width: 100%;"><font size=3px; face="Open Sans, Arial, sans-serif" text-align:justify;> | ||
| + | |||
| + | Our client is a well-established restaurant chain and international franchise with more than 18,000 stores operating in over 100 countries. In Taiwan, our client operates over 220 stores set up across various cities and has plans to further expand its operation in the coming years. | ||
| + | |||
| + | According to https://www.export.gov/article?id=Taiwan-Franchising-Industry-Sector, Taiwan is home to the largest concentration of international and local franchises in the world and the food and beverage franchise market in Taiwan is the most saturated and competitive. In view of the competitive business environment, it is essential for businesses to leverage data analytics to gain a competitive advantage. | ||
| + | |||
| + | In this project, our client has provided us with spatial data specifically for the region Taitung and Kaohsiung. Our team is motivated to find out the underlying reasons attributing to the sales figures for each of the respective stores in the regions. For instance, finding the correlation between the number/types of points of interest (POIs) within the trade area and sales performance. In essence, with the insights derived from our analysis, we aim to help our client achieve an increase in revenue as well as identifying the main drivers behind the success or failure of each store. | ||
| + | |||
| + | </font></div></div> | ||
| + | |||
| + | ==<div style="background: rgb(226, 113, 113); padding: 10px; font-weight: bold; font-family: Trebuchet MS; line-height: 1em; text-align: center; | ||
| + | border-left: #BEB9B5 solid 32px; font-size: 20px"><font color="white">Project Objective</font></div>== | ||
| + | |||
| + | <div style="border-left: #BEB9B5 solid 15px; padding: 0px 30px 0px 20px;"> | ||
| + | |||
| + | <div style="width: 100%;"><font size=3px; face="Open Sans, Arial, sans-serif" text-align:justify;> | ||
| + | |||
| + | '''The project aims to achieve the following objectives:''' | ||
| + | |||
| + | 1. Digitizing the assigned trade areas layers and extract the profile of each trade area | ||
| + | |||
| + | 2. Identifying discrepancies present in the hand-drawn map vs digitized maps. For example, overlaps in trade areas present in hand-drawn maps | ||
| + | |||
| + | 3. Create three buffers of 2.5km, 3km, and 3.5km for each trade area and remove overlapping boundaries | ||
| + | |||
| + | 4. Based on the trade areas delineated by the respective buffers, calculate the total number of points of interest (POIs) in each buffer | ||
| + | |||
| + | 5. Identify the correlation between the number of POIs within a trade area and the sales performance of the store | ||
| + | |||
| + | 6. Use network analysis method to address service areas delineation and assess the accessibility of site based on drive time | ||
| + | |||
| + | 7. Perform competitor analysis, determine whether the presence of competitors within the same trade area affects sales performance | ||
| − | + | 8. Use of analysis tools available in QGIS to plot charts. For example, depicting the sales performance of each store | |
| − | + | 9. Translate work in QGIS to web maps | |
| − | |||
| − | + | 10. Create a poster and project report documenting the team’s findings and analysis | |
| − | + | </font></div></div> | |
| − | |||
| − | <div style=" | + | ==<div style="background: rgb(226, 113, 113); padding: 10px; font-weight: bold; font-family: Trebuchet MS; line-height: 1em; text-align: center; |
| + | border-left: #BEB9B5 solid 32px; font-size: 20px"><font color="white">Data Collection</font></div>== | ||
| − | + | <div style="border-left: #BEB9B5 solid 15px; padding: 0px 30px 0px 20px;"> | |
| − | + | <div style="width: 100%;"><font size=3px; face="Open Sans, Arial, sans-serif" text-align:justify;> | |
| + | <br> | ||
| + | {| class="wikitable style="background-color:#FFFFFF;" width="100%" | ||
| + | |-style= "background-color:#BEB9B5" | ||
| + | !scope="row" colspan="4"|<b>''Admin Boundary''</b> | ||
| + | |- | ||
| + | |- | ||
| + | | County MOI || Shapefile (.shp) | ||
| + | |- | ||
| + | |- | ||
| + | | Town MOI || Shapefile (.shp) | ||
| + | |- | ||
| + | |- | ||
| + | | Village MOI || Shapefile (.shp) | ||
| + | |- | ||
| + | |-style= "background-color:#BEB9B5" | ||
| + | !scope="row" colspan="4"|<b>''Taiwan Stores''</b> | ||
| + | |- | ||
| + | | Taiwan Stores (inclusive of our 13 stores) || Geopackage (.gpkg) | ||
| + | |- | ||
| + | |-style= "background-color:#BEB9B5" | ||
| + | !scope="row" colspan="4"|<b>''Location Maps''</b> | ||
| + | |- | ||
| + | | RL-20190802 || PowerPoint Slides (.ppt) | ||
| + | |- | ||
| + | | UH-20171124寬104高87(鋁) || PowerPoint Slides (.ppt) | ||
| + | |- | ||
| + | | PN-20170816寬75高87(鋁)含框 || PowerPoint Slides (.ppt) | ||
| + | |- | ||
| + | | FS-20171106寬115高90(木)含框 || PowerPoint Slides (.ppt) | ||
| + | |- | ||
| + | | YP-20171214寬74高114(鋁) || PowerPoint Slides (.ppt) | ||
| + | |- | ||
| + | | HK-20171215寬90高130(木) || PowerPoint Slides (.ppt) | ||
| + | |- | ||
| + | | NS-20171122寬102高96(鋁) || PowerPoint Slides (.ppt) | ||
| + | |- | ||
| + | | LY-20171124寬90高125(鋁) || PowerPoint Slides (.ppt) | ||
| + | |- | ||
| + | | FA-20171214寬63高等比(鋁)含框 || PowerPoint Slides (.ppt) | ||
| + | |- | ||
| + | | EG-20171214寬113高103(鋁) || PowerPoint Slides (.ppt) | ||
| + | |- | ||
| + | | DO-20171121寬98高86(鋁) || PowerPoint Slides (.ppt) | ||
| + | |- | ||
| + | |-style= "background-color:#BEB9B5" | ||
| + | !scope="row" colspan="4"|<b>''Point of Interest (POI)''</b> | ||
| + | |- | ||
| + | | AutoSvc (for Grocery Store) || Shapefile (.shp) | ||
| + | |- | ||
| + | | Business (for Business Facility and Industrial Zone) || Shapefile (.shp) | ||
| + | |- | ||
| + | | ComSvc (for Government Office) || Shapefile (.shp) | ||
| + | |- | ||
| + | | Edulnsts (for Higher Education and School)|| Shapefile (.shp) | ||
| + | |- | ||
| + | | Entertn (for Night Life, Cinema, Bar or Pub and Performing Arts)|| Shapefile (.shp) | ||
| + | |- | ||
| + | | Finlnsts (for ATM and Bank) || Shapefile (.shp) | ||
| + | |- | ||
| + | | Hospital (for Hospital and Medical Service) || Shapefile (.shp) | ||
| + | |- | ||
| + | | MiscCategories (for Residential Area/Building) || Shapefile (.shp) | ||
| + | |- | ||
| + | | ParkRec (for Bowling Centre, Sports Complex and Sports Centre) || Shapefile (.shp) | ||
| + | |- | ||
| + | | Restrnts (for Restaurant and Coffee Sop) || Shapefile (.shp) | ||
| + | |- | ||
| + | | Shopping (for Shopping, Convenient Store, Clothing Store, Department Store, Pharmacy, Speciality Store, Consumer Electronics Store, Bookstore and Grocery Store) || Shapefile (.shp) | ||
| + | |- | ||
| + | | TransHubs (for Train Station, Bus Station, Commuter Rail Station)|| Shapefile (.shp) | ||
| + | |- | ||
| + | | TravDest (for Hotel)|| Shapefile (.shp) | ||
| + | |- | ||
| + | |-style= "background-color:#BEB9B5" | ||
| + | !scope="row" colspan="4"|<b>''Sales Data''</b> | ||
| + | |- | ||
| + | | Trade Area Annual Sales Data || Comma-Separated Values (.csv) | ||
| + | |- | ||
| + | |-style= "background-color:#BEB9B5" | ||
| + | !scope="row" colspan="4"|<b>''Streets''</b> | ||
| + | |- | ||
| + | | Streets || Shapefile (.shp) | ||
|} | |} | ||
| − | |||
| − | + | </font></div></div> | |
| − | |||
| − | <div style=" | + | ==<div style="background: rgb(226, 113, 113); padding: 10px; font-weight: bold; font-family: Trebuchet MS; line-height: 1em; text-align: center; |
| + | border-left: #BEB9B5 solid 32px; font-size: 20px"><font color="white">Scope of Work</font></div>== | ||
| − | + | <div style="border-left: #BEB9B5 solid 15px; padding: 0px 30px 0px 20px;"> | |
| − | + | <div style="width: 100%;"><font size=3px; face="Open Sans, Arial, sans-serif" text-align:justify;> | |
| − | | | + | [[File:Allocated store.jpg|800px|centre]] |
| − | < | + | <br> |
| − | + | [[File:G2T5 trade area.jpg|800px|centre]] | |
| − | |||
| − | < | + | <br> |
| − | {| | + | <center> |
| + | {| class="wikitable" | ||
| + | |- | ||
| + | ! Data Preparation !! Analysis Performed !! Project Deliverables | ||
| + | |- | ||
| + | | | ||
| + | * Data Cleaning (Pythons, Excel and QGIS) | ||
| + | * Digitize Trade Area | ||
| + | * Create 2.5km, 3km and 3.5km Buffer for Allocated Stores | ||
| + | * POI counts in Buffer Trade areas | ||
| + | * Create Contour for Network Analysis | ||
| − | + | || | |
| + | * Buffer Analysis | ||
| + | * Competitor Analysis | ||
| + | * Correlation Analysis | ||
| + | * Drive-Time Analysis | ||
| + | * Store Sales Analysis | ||
| + | * Trade Area Analysis | ||
| + | || | ||
| + | * Project Poster | ||
| + | * Final Report with User Manual | ||
| + | * Wiki Page | ||
|} | |} | ||
| + | </center> | ||
| + | |||
| + | |||
| + | </font></div></div> | ||
| + | |||
| + | ==<div style="background: rgb(226, 113, 113); padding: 10px; font-weight: bold; font-family: Trebuchet MS; line-height: 1em; text-align: center; | ||
| + | border-left: #BEB9B5 solid 32px; font-size: 20px"><font color="white">Project Schedule</font></div>== | ||
| + | |||
| + | <div style="border-left: #BEB9B5 solid 15px; padding: 0px 30px 0px 20px;"> | ||
| + | |||
| + | <div style="width: 100%;"><font size=3px; face="Open Sans, Arial, sans-serif" text-align:justify;> | ||
| − | </div> | + | Project Schedule |
| + | [[File:G2T5 Timeline.png|1000px|centre]] | ||
| + | </font></div></div> | ||
Latest revision as of 23:00, 24 November 2019
Contents
About Pingtung County and Kaohsiung City
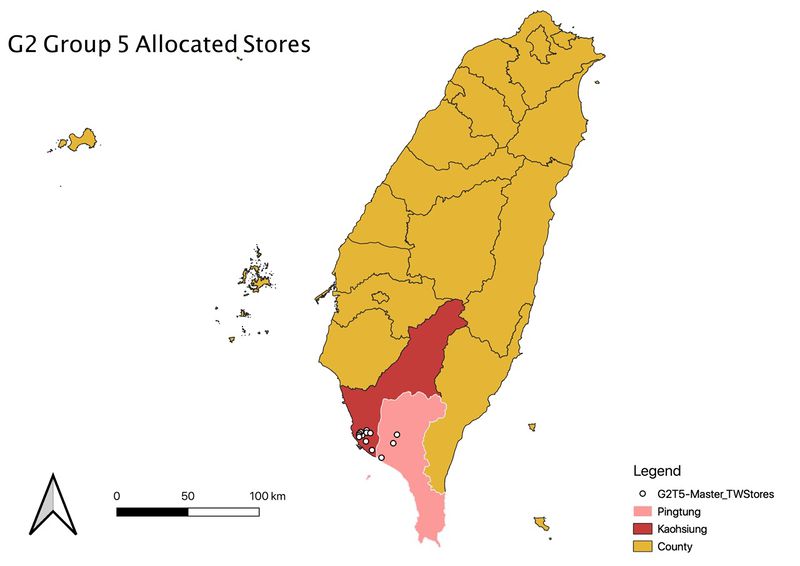
Pingtung is the southernmost and fifth-largest county of Taiwan. It is well known for its agriculture, producing sugarcane, rice, bananas tobaccos and fruits. Top attractions in Pingtung include Kenting National Park, Eluanbi Park, and Hengchun Old Town.
Kaohsiung City is the second-largest city in Taiwan and one of the largest ports in the world. A thriving international metropolis at the southern tip of Taiwan, Kaohsiung is home to several popular attraction sites such as Love River, Lotus Pond, and Qijin.
Project Motivation
Our client is a well-established restaurant chain and international franchise with more than 18,000 stores operating in over 100 countries. In Taiwan, our client operates over 220 stores set up across various cities and has plans to further expand its operation in the coming years.
According to https://www.export.gov/article?id=Taiwan-Franchising-Industry-Sector, Taiwan is home to the largest concentration of international and local franchises in the world and the food and beverage franchise market in Taiwan is the most saturated and competitive. In view of the competitive business environment, it is essential for businesses to leverage data analytics to gain a competitive advantage.
In this project, our client has provided us with spatial data specifically for the region Taitung and Kaohsiung. Our team is motivated to find out the underlying reasons attributing to the sales figures for each of the respective stores in the regions. For instance, finding the correlation between the number/types of points of interest (POIs) within the trade area and sales performance. In essence, with the insights derived from our analysis, we aim to help our client achieve an increase in revenue as well as identifying the main drivers behind the success or failure of each store.
Project Objective
The project aims to achieve the following objectives:
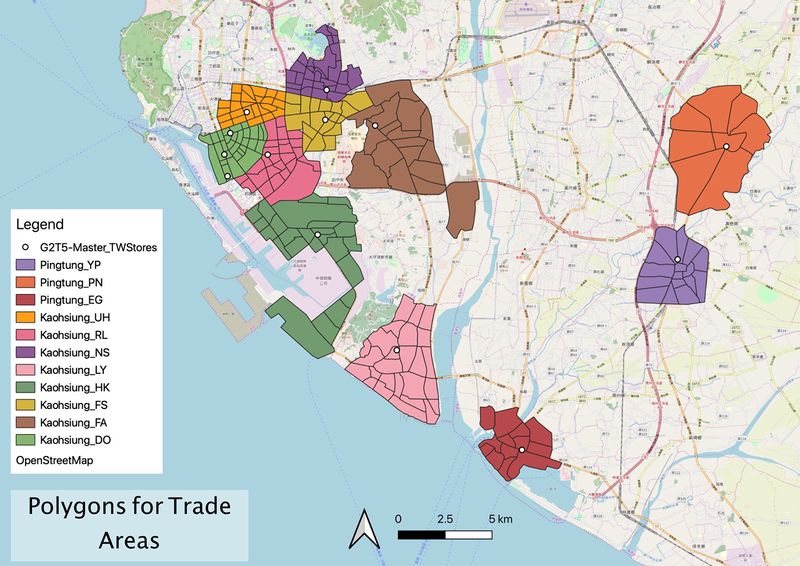
1. Digitizing the assigned trade areas layers and extract the profile of each trade area
2. Identifying discrepancies present in the hand-drawn map vs digitized maps. For example, overlaps in trade areas present in hand-drawn maps
3. Create three buffers of 2.5km, 3km, and 3.5km for each trade area and remove overlapping boundaries
4. Based on the trade areas delineated by the respective buffers, calculate the total number of points of interest (POIs) in each buffer
5. Identify the correlation between the number of POIs within a trade area and the sales performance of the store
6. Use network analysis method to address service areas delineation and assess the accessibility of site based on drive time
7. Perform competitor analysis, determine whether the presence of competitors within the same trade area affects sales performance
8. Use of analysis tools available in QGIS to plot charts. For example, depicting the sales performance of each store
9. Translate work in QGIS to web maps
10. Create a poster and project report documenting the team’s findings and analysis
Data Collection
| Admin Boundary | |||
|---|---|---|---|
| County MOI | Shapefile (.shp) | ||
| Town MOI | Shapefile (.shp) | ||
| Village MOI | Shapefile (.shp) | ||
| Taiwan Stores | |||
| Taiwan Stores (inclusive of our 13 stores) | Geopackage (.gpkg) | ||
| Location Maps | |||
| RL-20190802 | PowerPoint Slides (.ppt) | ||
| UH-20171124寬104高87(鋁) | PowerPoint Slides (.ppt) | ||
| PN-20170816寬75高87(鋁)含框 | PowerPoint Slides (.ppt) | ||
| FS-20171106寬115高90(木)含框 | PowerPoint Slides (.ppt) | ||
| YP-20171214寬74高114(鋁) | PowerPoint Slides (.ppt) | ||
| HK-20171215寬90高130(木) | PowerPoint Slides (.ppt) | ||
| NS-20171122寬102高96(鋁) | PowerPoint Slides (.ppt) | ||
| LY-20171124寬90高125(鋁) | PowerPoint Slides (.ppt) | ||
| FA-20171214寬63高等比(鋁)含框 | PowerPoint Slides (.ppt) | ||
| EG-20171214寬113高103(鋁) | PowerPoint Slides (.ppt) | ||
| DO-20171121寬98高86(鋁) | PowerPoint Slides (.ppt) | ||
| Point of Interest (POI) | |||
| AutoSvc (for Grocery Store) | Shapefile (.shp) | ||
| Business (for Business Facility and Industrial Zone) | Shapefile (.shp) | ||
| ComSvc (for Government Office) | Shapefile (.shp) | ||
| Edulnsts (for Higher Education and School) | Shapefile (.shp) | ||
| Entertn (for Night Life, Cinema, Bar or Pub and Performing Arts) | Shapefile (.shp) | ||
| Finlnsts (for ATM and Bank) | Shapefile (.shp) | ||
| Hospital (for Hospital and Medical Service) | Shapefile (.shp) | ||
| MiscCategories (for Residential Area/Building) | Shapefile (.shp) | ||
| ParkRec (for Bowling Centre, Sports Complex and Sports Centre) | Shapefile (.shp) | ||
| Restrnts (for Restaurant and Coffee Sop) | Shapefile (.shp) | ||
| Shopping (for Shopping, Convenient Store, Clothing Store, Department Store, Pharmacy, Speciality Store, Consumer Electronics Store, Bookstore and Grocery Store) | Shapefile (.shp) | ||
| TransHubs (for Train Station, Bus Station, Commuter Rail Station) | Shapefile (.shp) | ||
| TravDest (for Hotel) | Shapefile (.shp) | ||
| Sales Data | |||
| Trade Area Annual Sales Data | Comma-Separated Values (.csv) | ||
| Streets | |||
| Streets | Shapefile (.shp) | ||
Scope of Work
| Data Preparation | Analysis Performed | Project Deliverables |
|---|---|---|
|
|
|


