Difference between revisions of "SMT201 AY2019-20G2 Ex2 Lee Sean Jin"
| Line 35: | Line 35: | ||
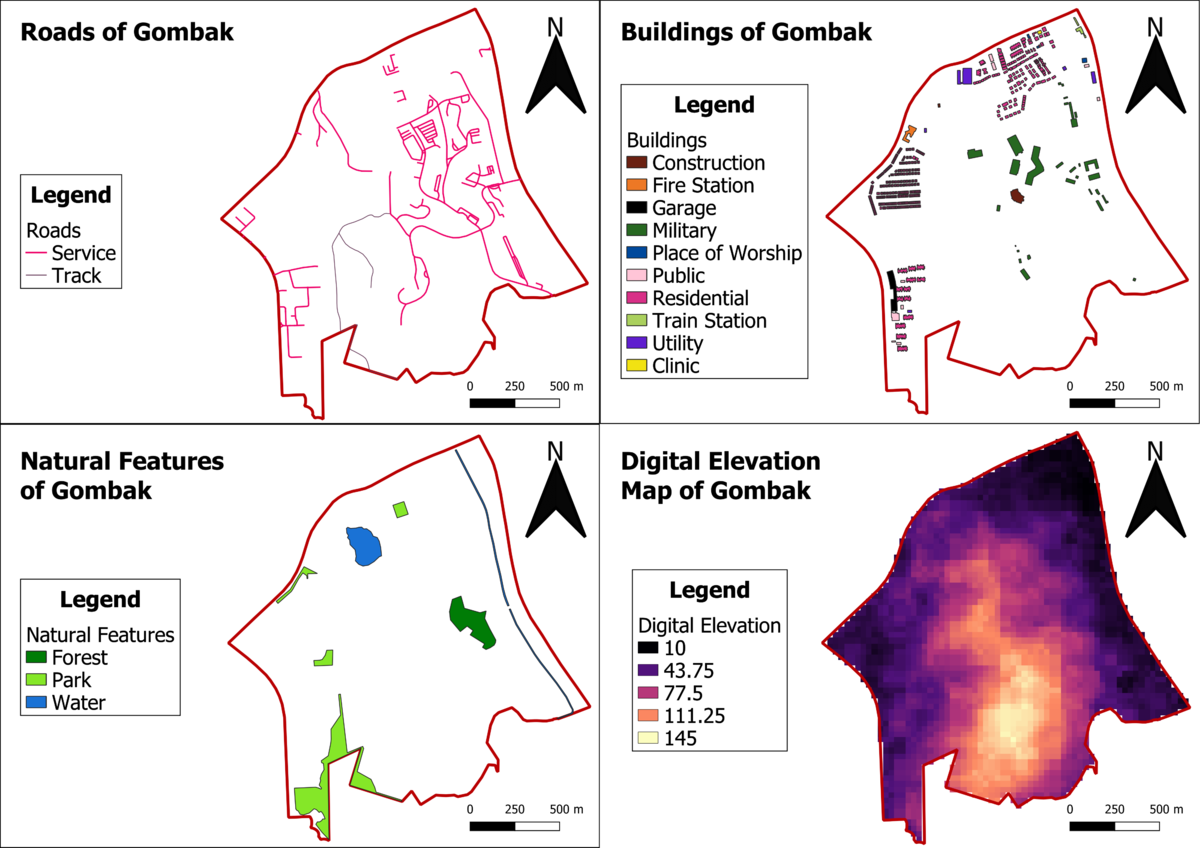
[[File:Map2.png|1200px|thumb|center|Data Source: Master Plan 2014 Subzone Boundary (No Sea) (SHP) from URA [https://data.gov.sg/dataset/master-plan-2014-subzone-boundary-no-sea]. Roads, Buildings and Natural (SHP) from OpenStreetMap [https://download.bbbike.org/osm/bbbike/Singapore/]. ASTER Global Digital Elevation Model (GDEM) dataset jointly prepared by NASA and METI, Japan [https://search.earthdata.nasa.gov/search?m=-7.175!25.59375!1!1!0!0%2C2]]] | [[File:Map2.png|1200px|thumb|center|Data Source: Master Plan 2014 Subzone Boundary (No Sea) (SHP) from URA [https://data.gov.sg/dataset/master-plan-2014-subzone-boundary-no-sea]. Roads, Buildings and Natural (SHP) from OpenStreetMap [https://download.bbbike.org/osm/bbbike/Singapore/]. ASTER Global Digital Elevation Model (GDEM) dataset jointly prepared by NASA and METI, Japan [https://search.earthdata.nasa.gov/search?m=-7.175!25.59375!1!1!0!0%2C2]]] | ||
<br> | <br> | ||
| + | === Road Proximity === | ||
| + | Dark areas of the map denotes closer proximity to the roads. Land areas that are more than 400m away from roads are denoted white. As discussed earlier, the darker areas will be more suitable for building the Quarantine Center. | ||
| + | <br> | ||
| + | === Building Proximity ==== | ||
| + | Dark areas of the map denotes closer proximity to the buildings. Land areas more than 400m away from the buildings are denoted white. As discussed earlier, the most suitable areas for building the Quarantine Center will be in the white areas of the map. | ||
| + | <br> | ||
| + | === Natural Features Proximity === | ||
| + | Dark areas of the map denotes close proximity to the natural features. Land areas more than 400m away from the buildings are denoted white. As discussed previously, the most suitable areas for building the Quarantine Center will be in the white areas of the map. | ||
| + | <br> | ||
| + | === Slope Analysis === | ||
| + | Brighter areas of the map denote steeper slopes whereas the darker areas denote areas that are less steep. As discussed previously, the most suitable areas for building the Quarantine Center will be in the darker regions of the map. | ||
<br> | <br> | ||
Revision as of 21:37, 10 November 2019
Contents
Objective
To identify a location suitable for building a National Communicable Disease Quarantine Centre. The selected site is located in the Gombak planning subzone, with a contiguous area of at least 10,000m2 and it must meet the following decision factors:
1. Economic factor: The selected site should avoid steep slope. This is because construction at steep slope tends to involve a lot of cut-and-fill and will lend to relatively higher development cost.
2. Accessibility factor: The selected site should be close to existing local roads, namely: service roads and tracks. This is to ensure easy transportation of building materials during the construction stage.
3. Health risk factor: The selected site should be away from population i.e. housing areas and offices in order to avoid disease spreading to the nearby population.
4. Natural conservation factor: The selected site should be away from forested land, park and water.
The main features of analysis as identified above will be as follows:
1. The Digital Elevation Map of Gombak.
2. Service roads and tracks in Gombak.
3. Buildings that has human traffic on a daily basis in Gombak.
4. Natural features containing forested land, parks and water bodies in Gombak.
Analysis of the features identified above
Accessibility Factor (Roads)
We identify roads to be a factor in determining accessibility because the proximity of the roads to the construction site will affect the ease of transporting building materials to a large degree. A large proportion of the roads in Gombak are service roads, with a minority being tracks. In the map above, the service roads lines are coloured pink and are thicker than the tracks which are coloured grey. There is a high concentration of roads in the East of Gombak.
Health Risk Factor (Buildings)
We identify buildings to be an important factor in assessing the health risk arose from the Quarantine Centre. As the site will contain patients with easily transmittable diseases, it is important to ensure that the location chosen be away from buildings with human traffic. Upon reviewing the data provided from BBBike, we realise that the building types are unknown for a significant proportion of the buildings. Using Google Maps, we are able to manually identify the types of buildings present in Gombak which helps us to identify the human traffic in the buildings. A large proportion of residential buildings are located along the North and West edges of Gombak.
Natural conservation factor (Natural features)
We identify natural features to be a factor in determining the natural conservation factor. As evident from the map, the natural features is a large waterbody in the centre of Gombak with a river in the East of Gombak. There is also a forest located in the centre of the map and a high concentration of parks in the South West region of Gombak.
Economic Factor (Digital Elevation)
We identify digital elevation to be an economic factor as it affects the cost of construction to a large degree. The steeper the slope, the higher the developmental costs due to more cut-and-fill occuring. As evident in the maps, the North, East and West edges of Gombak have lower elevation, while the central and South of Gombak have higher elevation.
Proximity Analysis of the identified features
Road Proximity
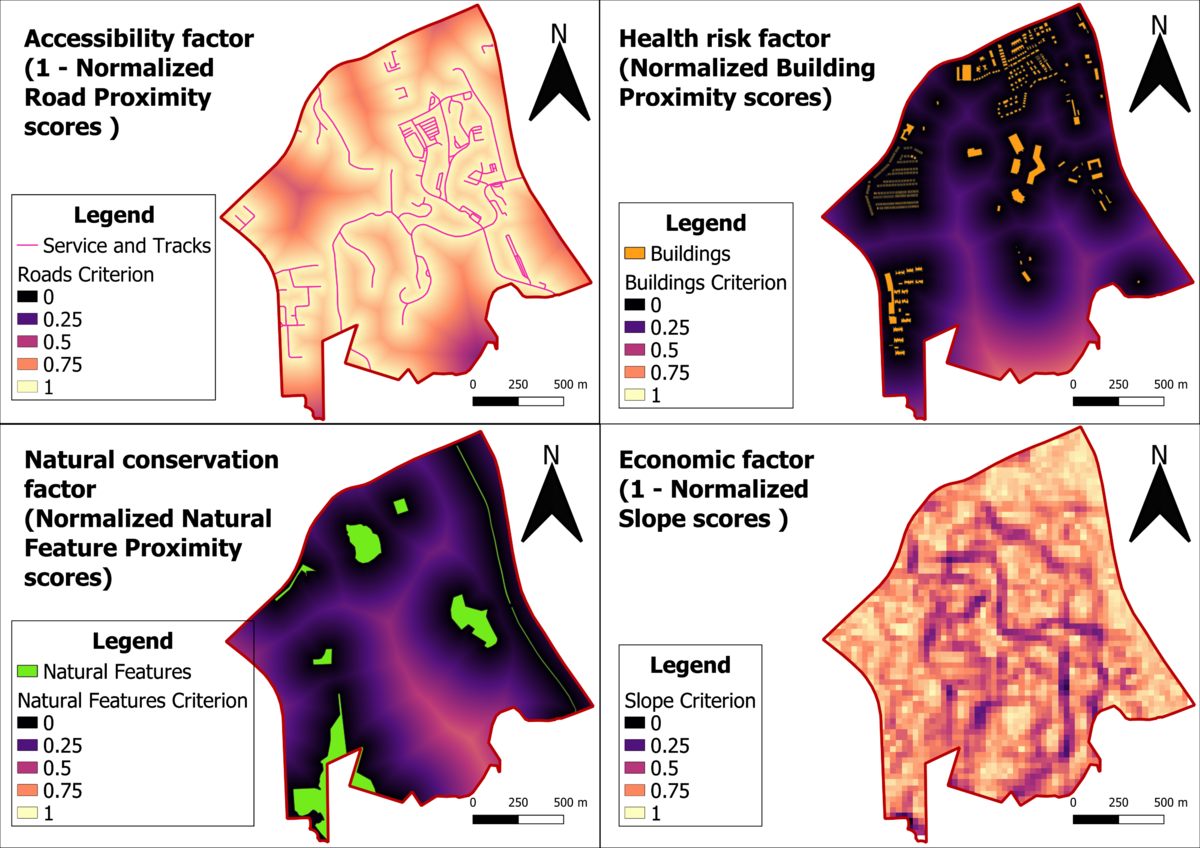
Dark areas of the map denotes closer proximity to the roads. Land areas that are more than 400m away from roads are denoted white. As discussed earlier, the darker areas will be more suitable for building the Quarantine Center.
Building Proximity =
Dark areas of the map denotes closer proximity to the buildings. Land areas more than 400m away from the buildings are denoted white. As discussed earlier, the most suitable areas for building the Quarantine Center will be in the white areas of the map.
Natural Features Proximity
Dark areas of the map denotes close proximity to the natural features. Land areas more than 400m away from the buildings are denoted white. As discussed previously, the most suitable areas for building the Quarantine Center will be in the white areas of the map.
Slope Analysis
Brighter areas of the map denote steeper slopes whereas the darker areas denote areas that are less steep. As discussed previously, the most suitable areas for building the Quarantine Center will be in the darker regions of the map.
Criterion Scores
Analytical Hierarchical Process input matrix and result report

Suitability Analysis
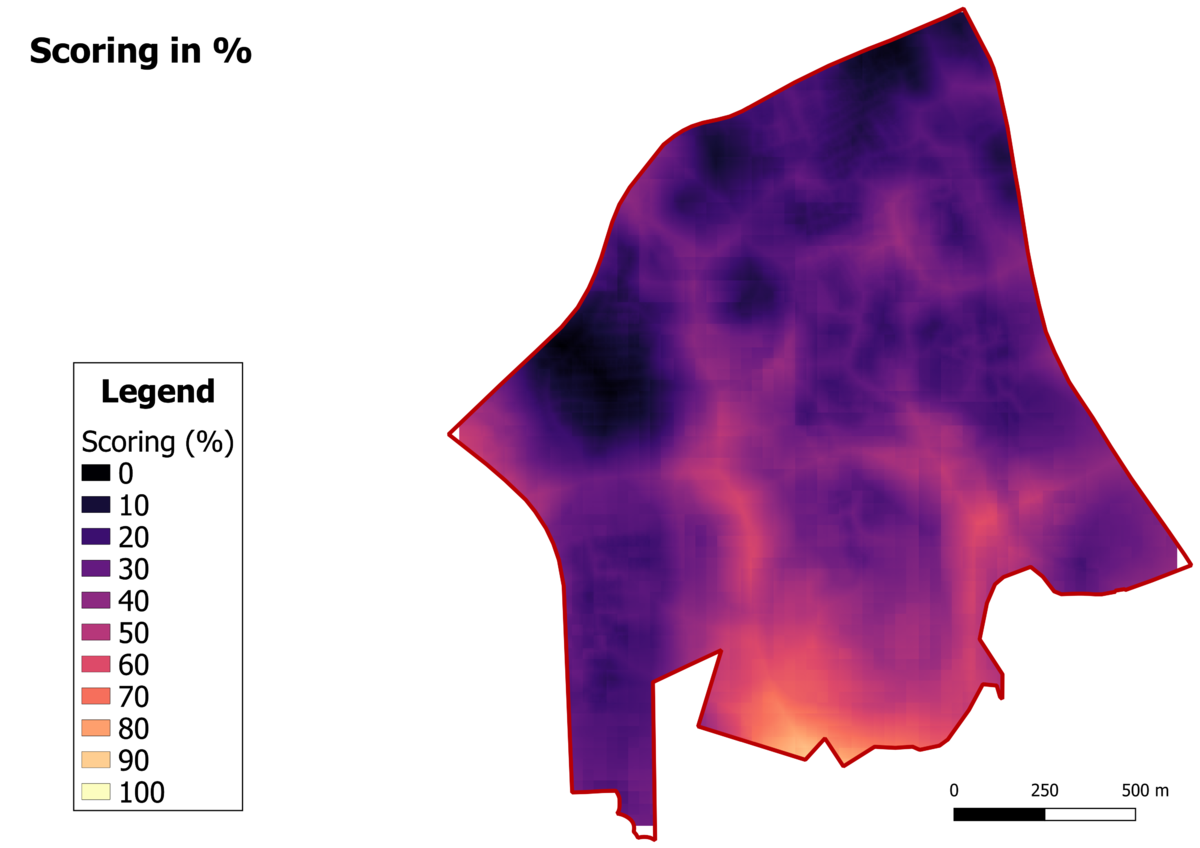
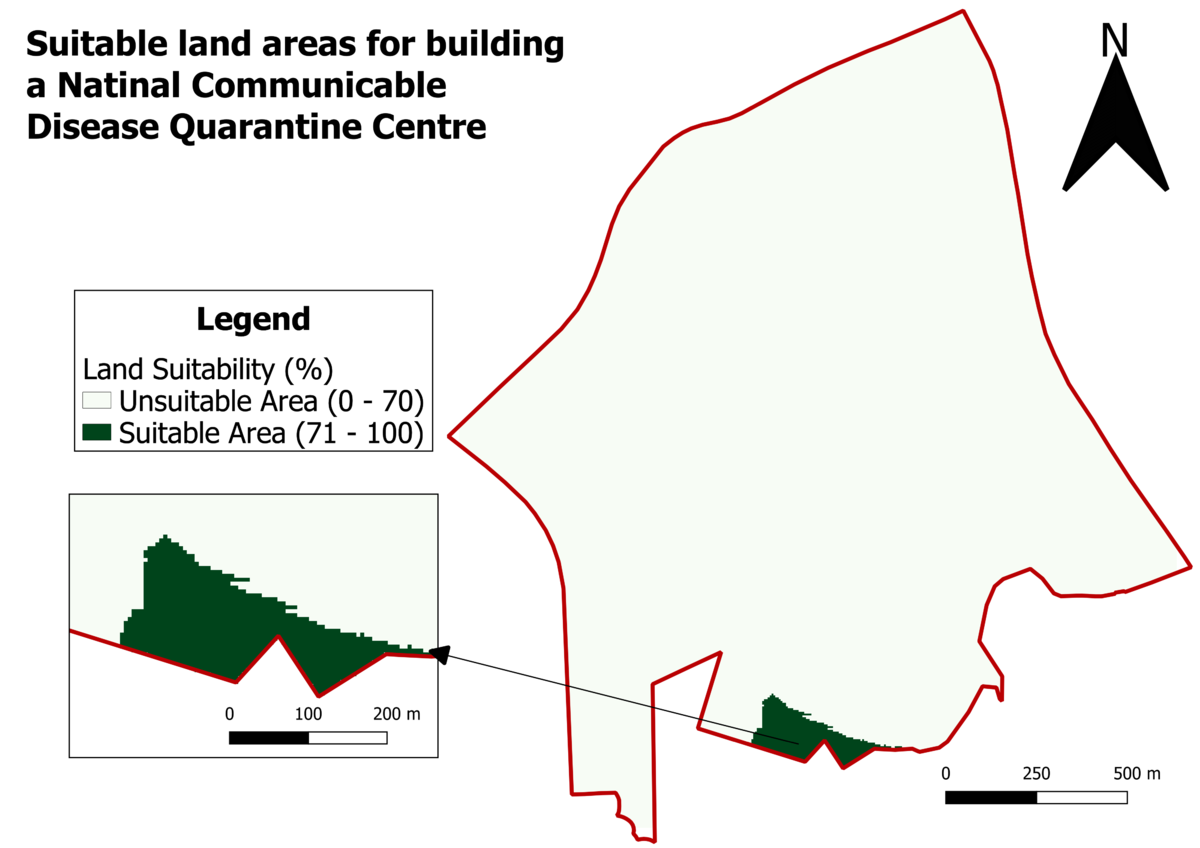
Suggested location for the National Communicable Disease Quarantine Centre
