Difference between revisions of "SMT201 AY2019-20G2 EX2 Khong Lee Han"
Lhkhong.2018 (talk | contribs) (→Part 5) |
Lhkhong.2018 (talk | contribs) |
||
| (29 intermediate revisions by the same user not shown) | |||
| Line 36: | Line 36: | ||
'''Elevation:''' The selected site needs to avoid slope as this will incur large construction cost as steep slopes involves a lot of cut-and-fills and leads to relatively higher development costs. The data was extracted from NASA's EarthData Search Site and was prepared by importing the raster data into QGIS. The higher the value, the higher the elevation of the location , measured in degrees. | '''Elevation:''' The selected site needs to avoid slope as this will incur large construction cost as steep slopes involves a lot of cut-and-fills and leads to relatively higher development costs. The data was extracted from NASA's EarthData Search Site and was prepared by importing the raster data into QGIS. The higher the value, the higher the elevation of the location , measured in degrees. | ||
| − | == Part 2 == | + | == Part 2: Proximity Map Layers == |
| + | |||
| + | |||
| + | |||
| + | [[File:2ndproxmap.png|800px|left]] | ||
| − | |||
<br> | <br> | ||
| Line 80: | Line 83: | ||
== Part 3: Criterion Score of Factor Layers == | == Part 3: Criterion Score of Factor Layers == | ||
| − | [[File:Map3 | + | In order to normalize the data, the min-max method was used to standardize the layers. |
| + | |||
| + | {| class="wikitable" | ||
| + | |- | ||
| + | | '''Economic'''|| (proxslope_layer-0)/(36.4308-0) | ||
| + | |- | ||
| + | | '''Accessibility'''|| (proxroad_layer-0)/(722.496-0) | ||
| + | |- | ||
| + | | '''Health Risk'''|| (proxbuildings_layer-0)/(826.62-0) | ||
| + | |- | ||
| + | | '''Natural Conservation'''|| (proxnatural_features-0)/(863.669-0) | ||
| + | |} | ||
| + | |||
| + | |||
| + | |||
| + | [[File:Map3 slope.png|400px|left]] | ||
| + | |||
| − | + | For the slope layer, the lower the criterion scores, the more suitable the location to build the disease centre, which is represented by a value of <0.2. | |
| Line 97: | Line 116: | ||
| − | [[File: | + | [[File:Map3 road.png|400px|left]] |
| − | + | For the road layer, the lower the criterion scores, the more suitable the location to build the disease centre, which is represented by a value of <0.2. | |
<br> | <br> | ||
| Line 113: | Line 132: | ||
<br> | <br> | ||
| + | [[File:Map3_buildings.png|left|400px]] | ||
| − | |||
| − | + | For the buildings layer, the higher the values, the more suitable the location to build the disease centre, which is represented by a value of 0.8-1.0. | |
<br> | <br> | ||
| Line 130: | Line 149: | ||
| − | |||
| − | |||
| − | + | [[File:Map3 natural.png|400px|left]] | |
| − | |||
| − | |||
| − | |||
| − | |||
| − | |||
| − | |||
| − | |||
| − | |||
| − | |||
| − | |||
| − | |||
| − | + | For natural features, the higher the values, the more suitable the location to build the disease centre, which is represented by a value of 0.8-1.0 | |
| − | |||
| − | |||
<br> | <br> | ||
<br> | <br> | ||
| Line 163: | Line 167: | ||
<br> | <br> | ||
<br> | <br> | ||
| − | <br> | + | <br><br> |
| − | |||
| − | <br> | ||
<br><br> | <br><br> | ||
<br> | <br> | ||
<br> | <br> | ||
<br> | <br> | ||
| − | + | ||
| + | == Part 4: Analytical Hierarchical Process Input Matrix & Result Report == | ||
| + | |||
| + | [[File:Pairwise comparison.png|500px|thumb|centre]] | ||
| + | |||
| + | [[File:Ratio.png|500px|thumb|centre]] | ||
| + | |||
| + | |||
| + | '''Importance of Location Characteristics:''' | ||
| + | |||
| + | 1.Natural Features (most important): Natural features is the most important factor as diseases were to be airborne or once the water touches the reservoirs and canals, it can easily contaminate the waters of Singapore, causing a widespread infection of the disease. | ||
| + | |||
| + | 2.Health Risk (2nd most important): Singapore is has a high population density and if the disease easily reaches nearby buildings, it would easily cause multiplier effect and the masses would be affected very quickly. Hence, it is important that the disease centre is not at a location that is near to people. | ||
| + | |||
| + | 3.Economic (3rd most important): As it is built by the government, cost would not be a major issue as a disease quarantine centre is a necessary place to be built. However, if built on a slope, much cost would be incurred and would be a bigger issue than road paving, which would cost much less. | ||
| + | |||
| + | 4.Accessibility (4th most important) Accessibility of the roads is somewhat important but not the biggest issue as Singapore is easily accessible to everywhere and anywhere. | ||
| + | |||
| + | == Part 5: Suitability Land Lot== | ||
| + | |||
| + | |||
| + | [[File:Suitability.png|600px|centre]] | ||
| + | |||
| + | [[File:Area-map.png|500px|thumb|centre]] | ||
| + | |||
| + | The following area in brown, would be the most suitable land area to build a disease center as it has a land size of 41732 m^2. However, it is currently used by MINDEF and further negotiations would be required to decide whether a disease centre can be built there instead of training grounds for MINDEF. | ||
| + | |||
<br> | <br> | ||
<br> | <br> | ||
| Line 177: | Line 205: | ||
<br> | <br> | ||
<br> | <br> | ||
| − | |||
| − | |||
| − | |||
| − | |||
| − | [[File: | + | '''Approach to attaining Suitability Land Lot''' |
| + | |||
| + | |||
| + | [[File:Rastercalculator.png|500px|thumb|centre]] | ||
| + | |||
| + | |||
| + | |||
| + | Firstly, the suitability land plot is created by using the weights generated from the AHP report and inputing this formula into the 'Raster Calculator' feature : | ||
| + | 0.092*(1-"slope_normalized@1") +0.050*(1-"prox_roads_normalized@1")+0.320*"proxbuildings_normalized@1"+0.538*"prox_natural_normalized@1" | ||
| − | + | Then, the rasterized combined layer was converted into a vector layer using the 'Polygonize' feature. Following, an additional column was added to the attribute table which showed the area size of each feature. Then only areas with > 10000 metres squared was choosen. | |
Latest revision as of 21:00, 10 November 2019
Contents
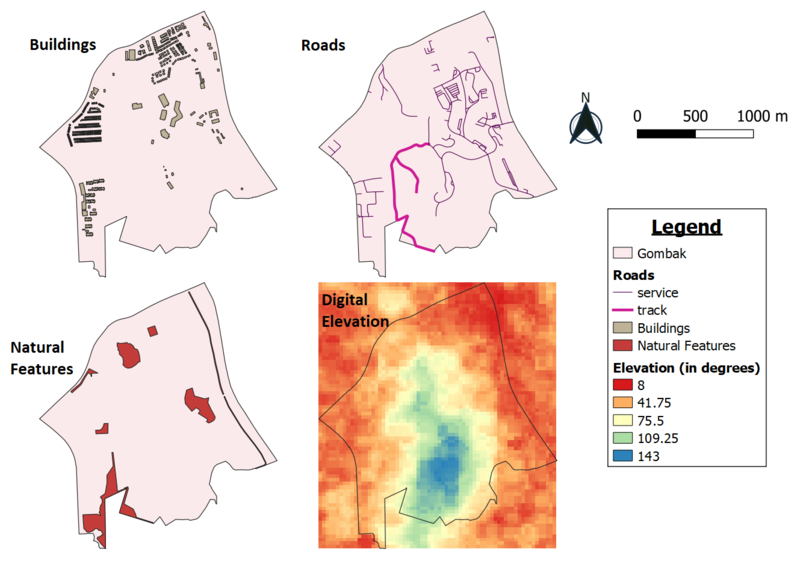
Part 1 : Map View with Study Area and Target Roads, Buildings, Natural Features, Digital Elevations Layer
Buildings: To build a disease centre, it needs to be far away from the population to prevent spreading of diseases to the nearby population. The data was extracted from BBBike@Singapore. As Singapore is highly compact, once the disease hits a population, it can easily spread and is important to keep the disease centre away from nearby population.
Target Roads: To build a disease centre, it needs to be close to existing local roads, namely: service roads and tracks to ensure easy transportation of building materials during the construction stage. The data was extracted from BBBike@Singapore. The targeted roads had to be extracted by 'select features using an expression' to extract the service roads and tracks from the 'type' column.
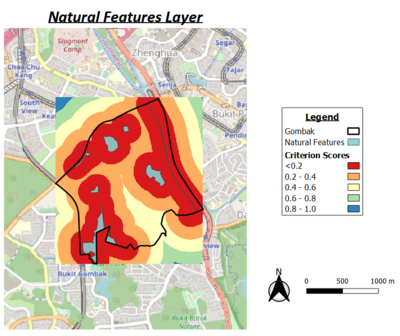
Natural Conservation: The selected site needs to be away from forested land, park and water as when the disease enter the water bodies of Singapore. The data was extracted from BBBike@Singapore.
Elevation: The selected site needs to avoid slope as this will incur large construction cost as steep slopes involves a lot of cut-and-fills and leads to relatively higher development costs. The data was extracted from NASA's EarthData Search Site and was prepared by importing the raster data into QGIS. The higher the value, the higher the elevation of the location , measured in degrees.
Part 2: Proximity Map Layers
Preparation for Proximity Calculation : To prepare the proximity layer, the vector layers of (buildings,roads, natural) needs to be rasterised such that the proximity of the features can be calculated. Proximity (Raster Distance) needs to the input GIS layer in raster format.
Buildings: The furthest distance from any point to a building within the Gombak study area is 826.62m whereas the closest distance to a building is 0m.
Target Roads: The furthest distance within the Gombak study area to a road is 722.496m and the closest distance is 0m.
Natural Conservation: The furthest distance within the Gombak study area to natural features is 863.669m and the closest distance is 0m.
Elevation: The minimum and maximum of slope features within Gombak is 0 and 36.4308 degrees respectively.
Part 3: Criterion Score of Factor Layers
In order to normalize the data, the min-max method was used to standardize the layers.
| Economic | (proxslope_layer-0)/(36.4308-0) |
| Accessibility | (proxroad_layer-0)/(722.496-0) |
| Health Risk | (proxbuildings_layer-0)/(826.62-0) |
| Natural Conservation | (proxnatural_features-0)/(863.669-0) |
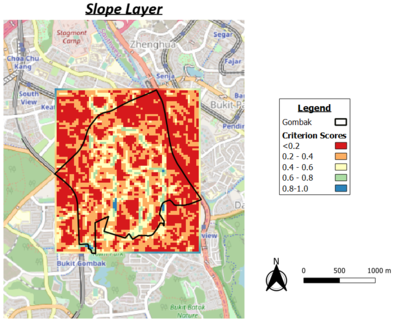
For the slope layer, the lower the criterion scores, the more suitable the location to build the disease centre, which is represented by a value of <0.2.
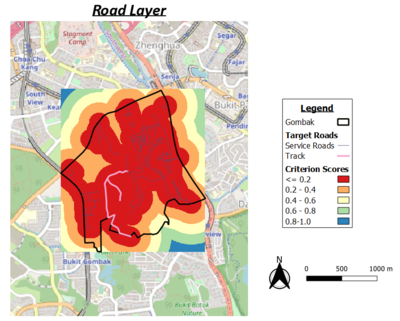
For the road layer, the lower the criterion scores, the more suitable the location to build the disease centre, which is represented by a value of <0.2.
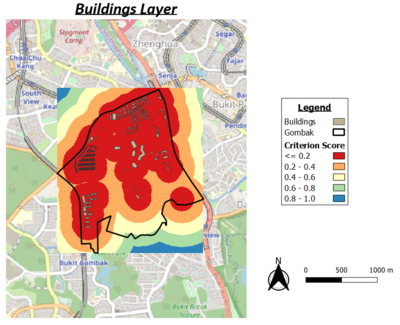
For the buildings layer, the higher the values, the more suitable the location to build the disease centre, which is represented by a value of 0.8-1.0.
For natural features, the higher the values, the more suitable the location to build the disease centre, which is represented by a value of 0.8-1.0
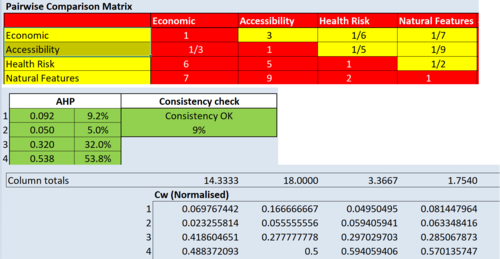
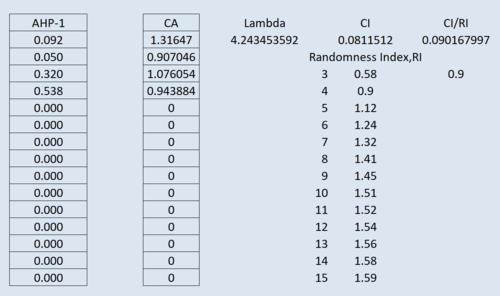
Part 4: Analytical Hierarchical Process Input Matrix & Result Report
Importance of Location Characteristics:
1.Natural Features (most important): Natural features is the most important factor as diseases were to be airborne or once the water touches the reservoirs and canals, it can easily contaminate the waters of Singapore, causing a widespread infection of the disease.
2.Health Risk (2nd most important): Singapore is has a high population density and if the disease easily reaches nearby buildings, it would easily cause multiplier effect and the masses would be affected very quickly. Hence, it is important that the disease centre is not at a location that is near to people.
3.Economic (3rd most important): As it is built by the government, cost would not be a major issue as a disease quarantine centre is a necessary place to be built. However, if built on a slope, much cost would be incurred and would be a bigger issue than road paving, which would cost much less.
4.Accessibility (4th most important) Accessibility of the roads is somewhat important but not the biggest issue as Singapore is easily accessible to everywhere and anywhere.
Part 5: Suitability Land Lot
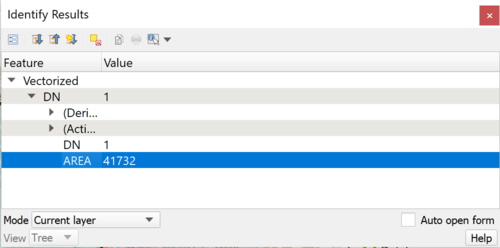
The following area in brown, would be the most suitable land area to build a disease center as it has a land size of 41732 m^2. However, it is currently used by MINDEF and further negotiations would be required to decide whether a disease centre can be built there instead of training grounds for MINDEF.
Approach to attaining Suitability Land Lot
Firstly, the suitability land plot is created by using the weights generated from the AHP report and inputing this formula into the 'Raster Calculator' feature : 0.092*(1-"slope_normalized@1") +0.050*(1-"prox_roads_normalized@1")+0.320*"proxbuildings_normalized@1"+0.538*"prox_natural_normalized@1"
Then, the rasterized combined layer was converted into a vector layer using the 'Polygonize' feature. Following, an additional column was added to the attribute table which showed the area size of each feature. Then only areas with > 10000 metres squared was choosen.
