Difference between revisions of "SMT201 AY2019-20T1 EX2 Tay Jing Wen"
| Line 2: | Line 2: | ||
[[File:Vector Format.png|1000x1000px|frameless|center]] | [[File:Vector Format.png|1000x1000px|frameless|center]] | ||
=== Description === | === Description === | ||
| − | Buildings: <br><br> | + | Buildings: This map layout will show the position of the building which accounts for the health risk factor as we want the Communicable Disease Quarantine Centre to be away from the crowd to prevent any spread of diseases. <br><br> |
| − | Natural: <br><br> | + | Natural: This map layout includes the natural elements in Gombak and is identified through <br><br> |
Roads: <br><br> | Roads: <br><br> | ||
Digital Elevation: <br><br> | Digital Elevation: <br><br> | ||
| Line 37: | Line 37: | ||
[[File:Suitability 2.png|1000x1000px|frameless|center]] | [[File:Suitability 2.png|1000x1000px|frameless|center]] | ||
<br><br> | <br><br> | ||
| + | [[File:Land Lot1.png|1000x1000px|frameless|center]] | ||
| + | <br><br> | ||
| + | Area | ||
Revision as of 20:14, 10 November 2019
Contents
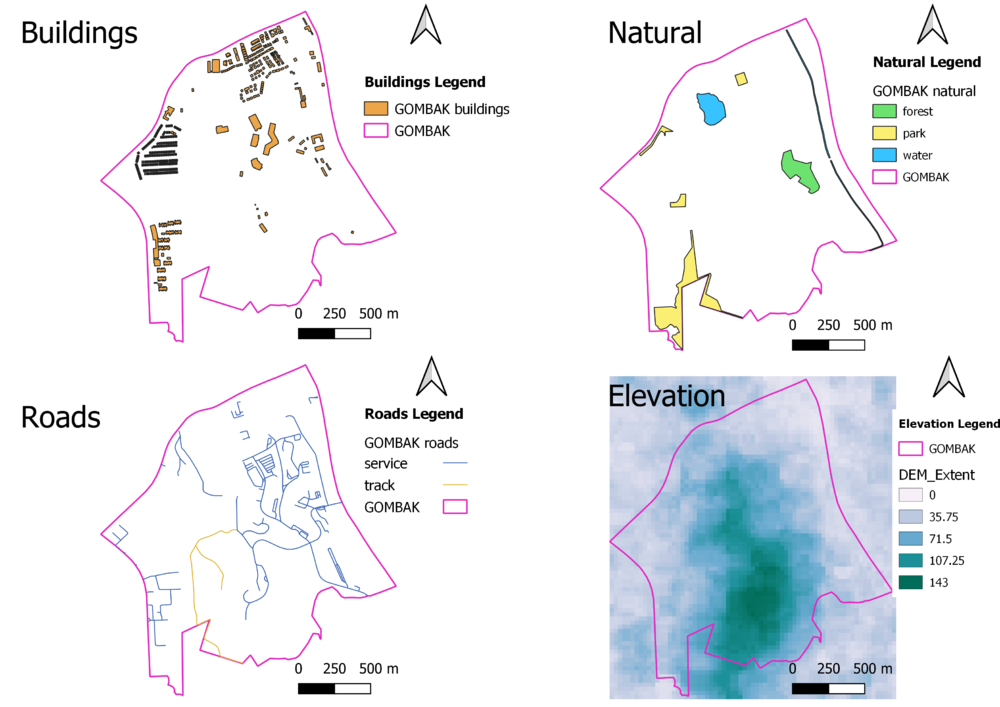
PART 1: Gombak and the 4 Target Views
Description
Buildings: This map layout will show the position of the building which accounts for the health risk factor as we want the Communicable Disease Quarantine Centre to be away from the crowd to prevent any spread of diseases.
Natural: This map layout includes the natural elements in Gombak and is identified through
Roads:
Digital Elevation:
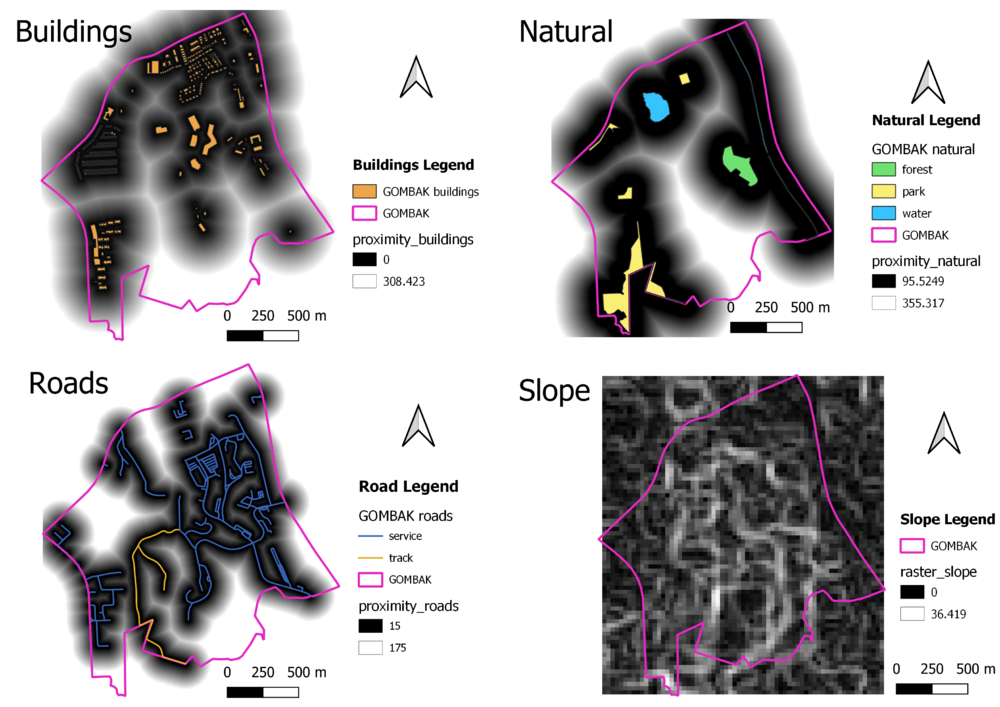
PART 2: Gombak and the 4 Proximity Views
Description
Buildings:
Natural:
Roads:
Slope:
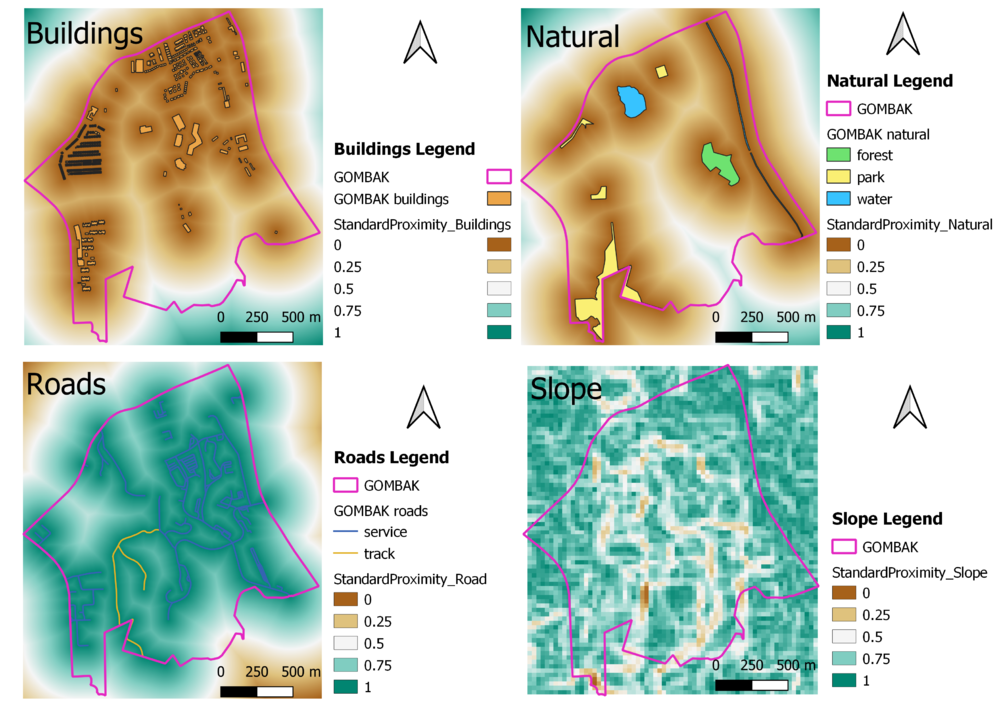
PART 3: Criterion Score
Description
To apply Standardization with minmax, the minimum and maximum values are retrieve through Raster Layer Statistics. The following shows the formula and values to standardardize each layer.
Buildings: ("proximity_buildings@1" - 0) / (838.4658813476562 - 0)
Natural: ("proximity_natural@1" - 0) / (863.6694946289062 - 0)
Roads: 1 - (("proximity_roads@1" - 0) / (743.303466796875 - 0))
Slope: 1 - (("raster_slope@1" - 0) / (36.41904830932617 - 0))
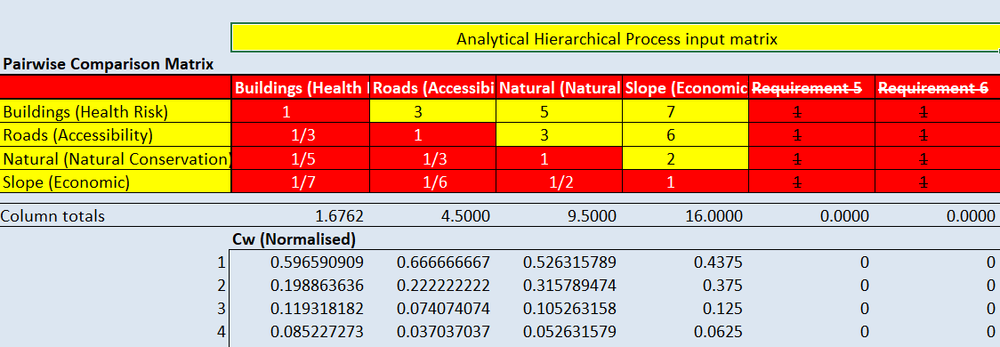
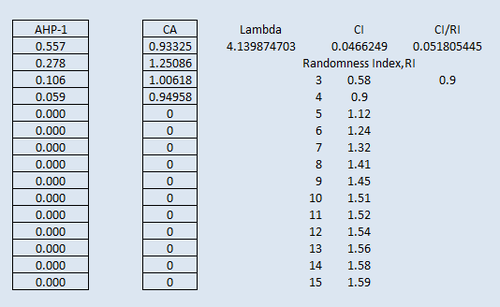
PART 4: Analytical Hierarchical Process Input Matrix
Reading from row to column,
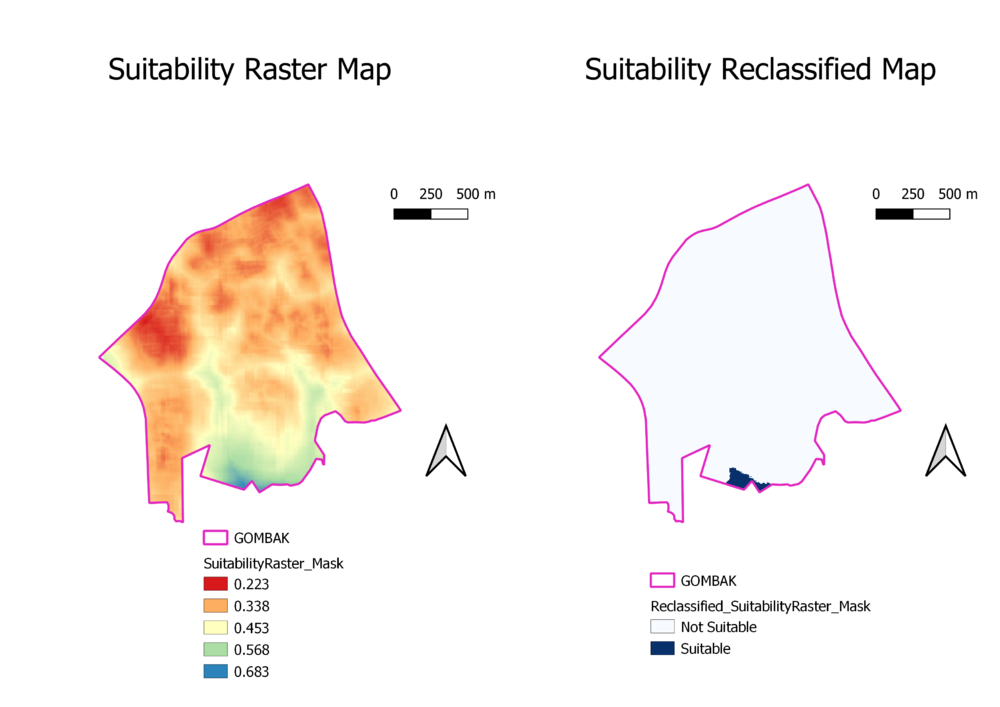
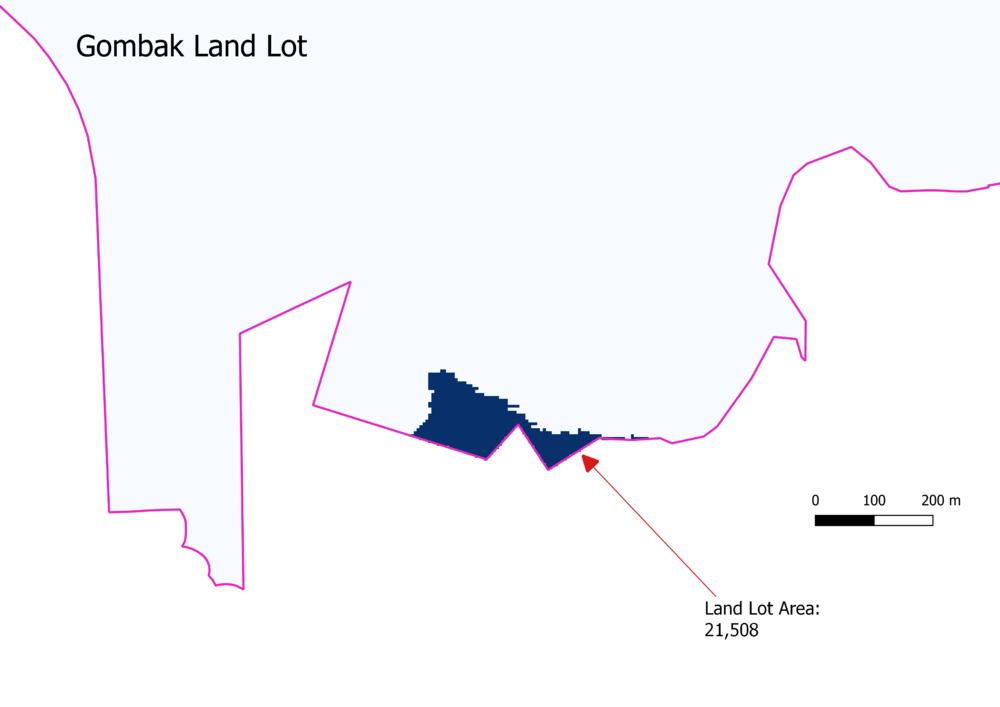
PART 5: Suitability Land Lot
Area
