Difference between revisions of "SMT201 AY2019-20G2 EX2 Lek Jan Yee Lois"
| Line 47: | Line 47: | ||
==Part 5: Land Suitability== | ==Part 5: Land Suitability== | ||
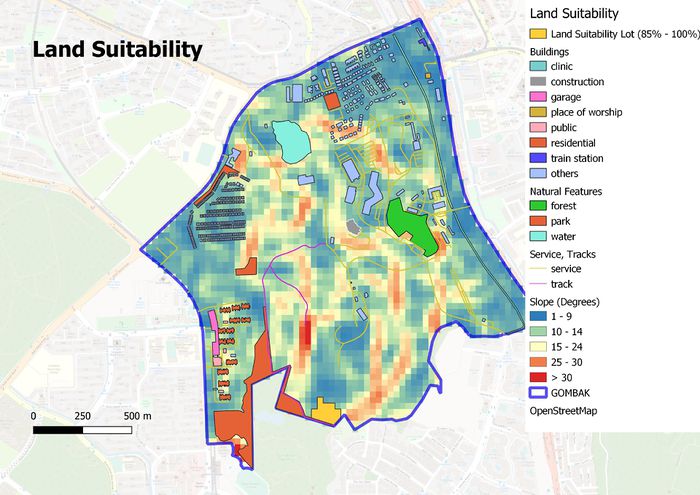
| − | [[File:Suitable Land Lots.png| | + | [[File:Suitable Land Lots.png|700px|frameless|center]]<br> |
| − | [[File:Land Suitability Lot.jpg| | + | Using the standardised results from part 3, I merged all four layers together by using the raster calculator. Each factor was multiplied by its respective AHP value to give weightage. |
| − | [[File:Suitability Land Lot.png| | + | |
| + | [[File:Percentage of Total.png|700px|frameless|center]]<br> | ||
| + | The range of results for the merged layer was from 0.207 to 0.867. To get an understanding of the optimal values, I standardised the results again and selected the region where it was more than equals to 85%. | ||
| + | |||
| + | [[File:Land Suitability Lot.jpg|700px|frameless|center]]<br> | ||
| + | |||
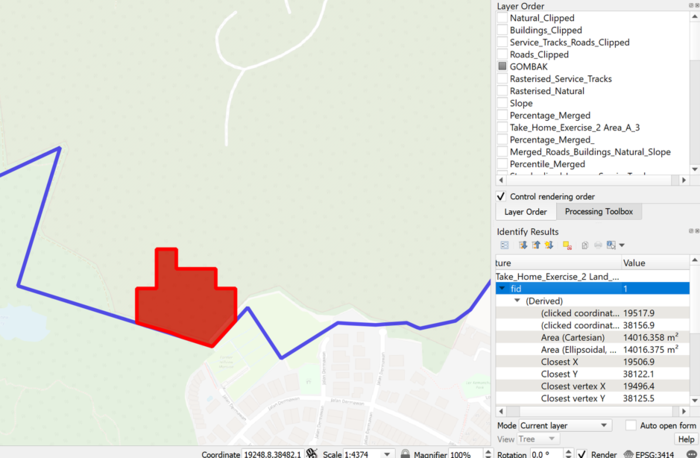
| + | [[File:Suitability Land Lot.png|700px|frameless|center]]<br> | ||
| + | |||
Revision as of 19:36, 10 November 2019
Contents
GIS Modelling for Urban Land Suitability Study
We are conducting a study to identify a suitable location for building a National Communicable Disease Quarantine Centre located at Gombak planning subzone. The site would need to have a contiguous area of at least 10,000m2 and meet the following criteria:
1) Economic factor: The site should avoid having steep slopes as that would require cutting and filling which would amount to a relatively higher development cost.
2) Accessibility factor: The site should be close to existing roads (service roads and tracks) for easy transportation of building materials
3) Health risk factor: The site should be away from the population as we would want to prevent the disease from spreading.
4) Natural conservation factor: The site should be away from forested land, water and parks.
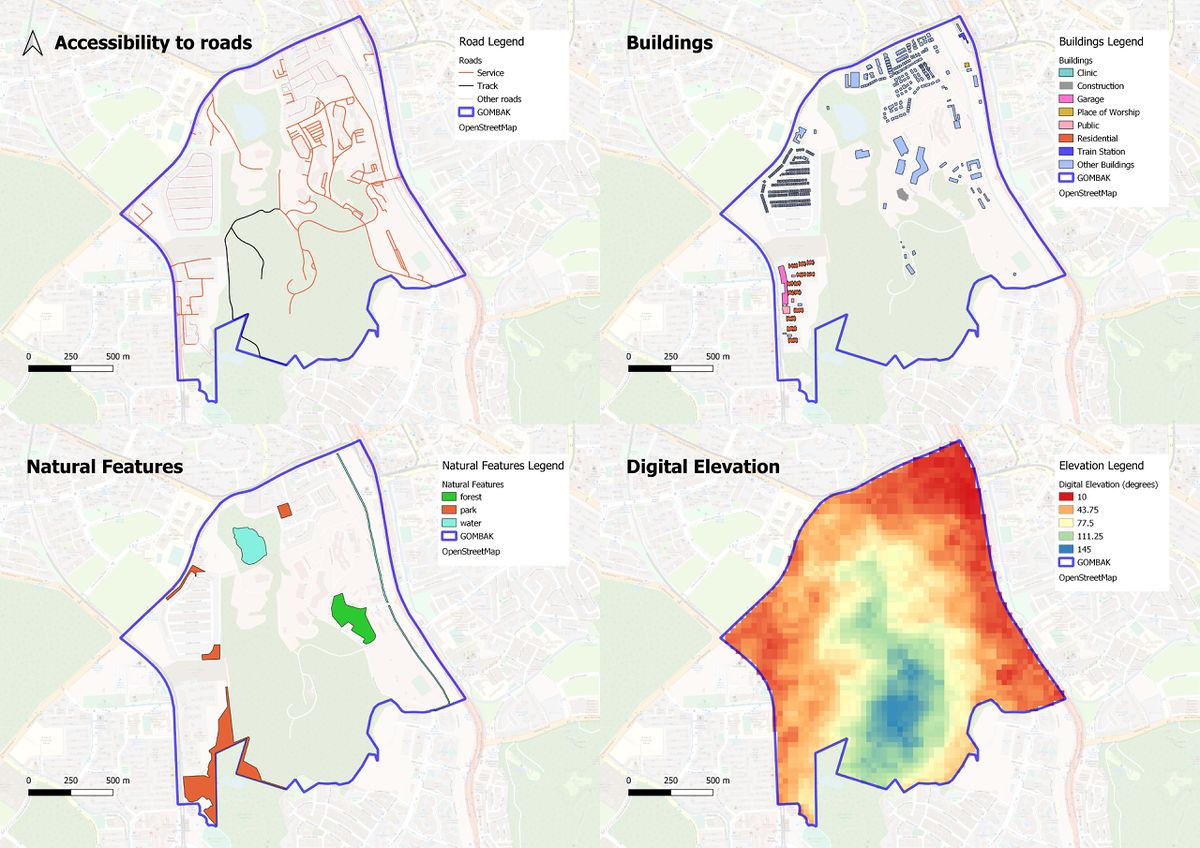
Part 1: Map View with Study Area, Target Roads, Buildings, Natural Features, Digital Elevation
| Layer | Header text |
|---|---|
| Target Roads | Example |
| Buildings | Example |
| Example | Example |
| Example | Example |
The data for this analysis was obtained from the Master Plan 2014 Subzone Boundary, BBBike Singapore (buildings, roads, nature) and ASTER Global Digital Elevation Model (Elevation raster layer).
Part 2: Proximity Analysis
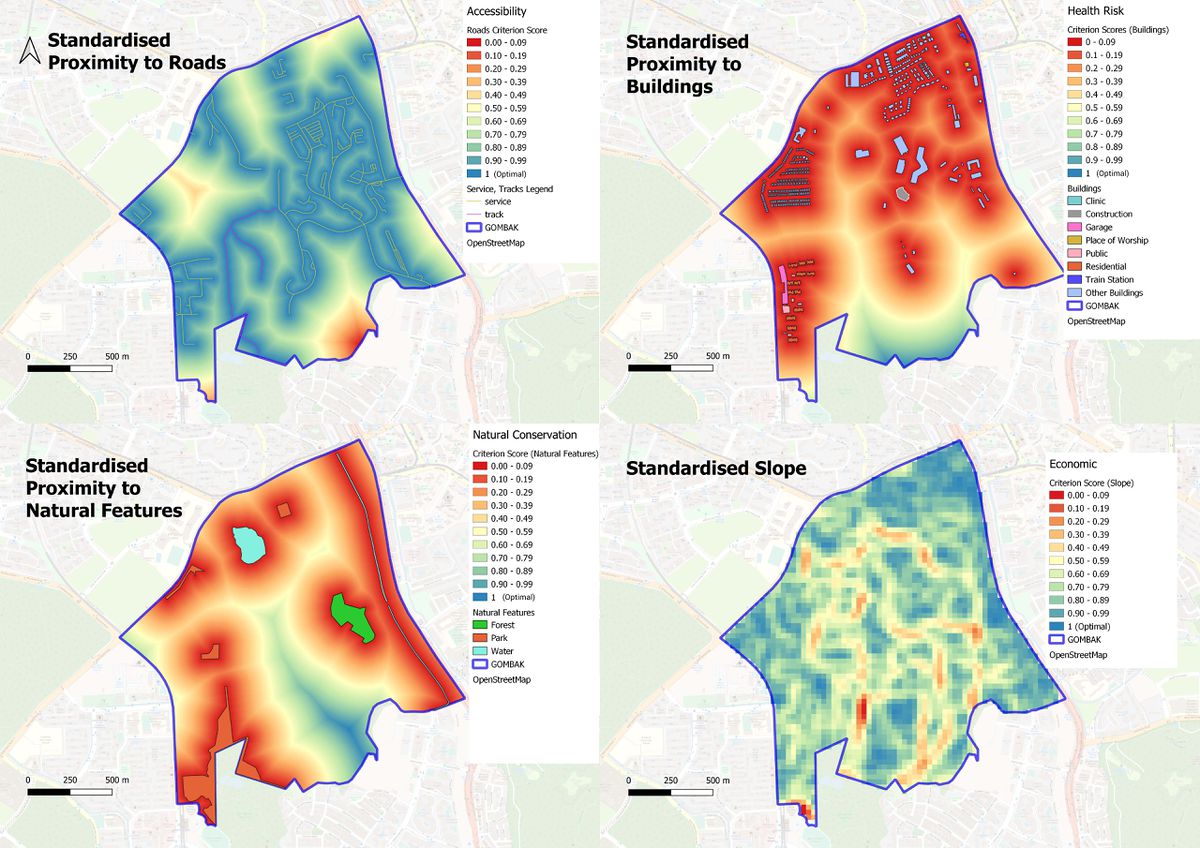
Part 3: Criteria Scores
| Layer | Description |
|---|---|
| Standardised Proximity to Buildings | Example |
| Example | Example |
| Example | Example |
Part 4: Analytical Hierarchical Process
Part 5: Land Suitability
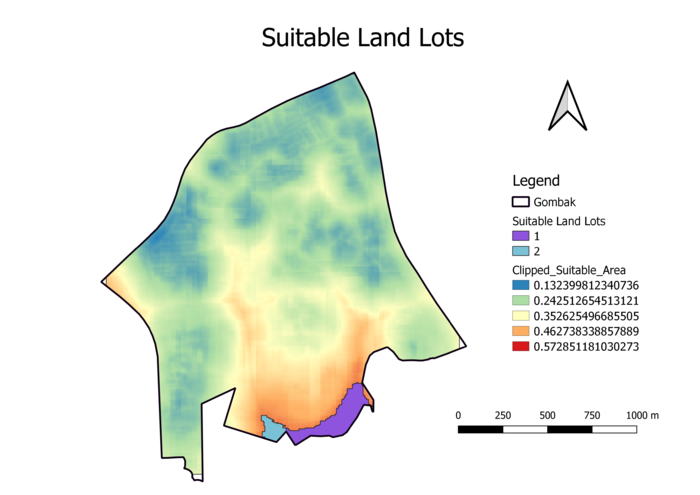
Using the standardised results from part 3, I merged all four layers together by using the raster calculator. Each factor was multiplied by its respective AHP value to give weightage.
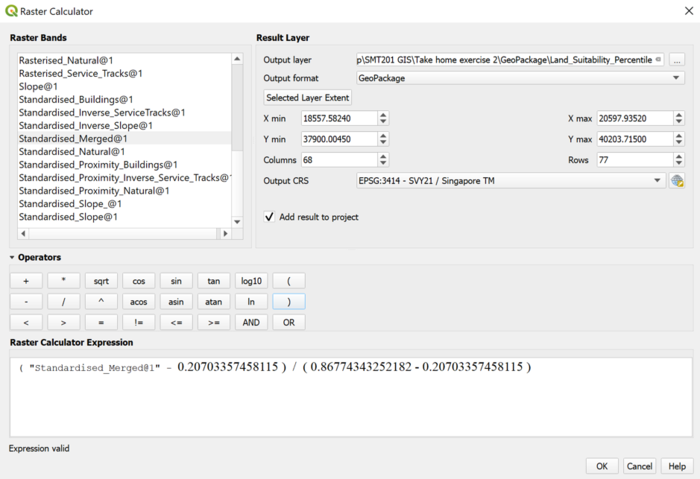
The range of results for the merged layer was from 0.207 to 0.867. To get an understanding of the optimal values, I standardised the results again and selected the region where it was more than equals to 85%.
