Difference between revisions of "SMT201 AY2019-20T1 EX2 Tang Wan Yee"
(Created page with "== Map 1: Map Layout With 4 views showing Roads, Buildings, Natural Features and Digital Elevation == 400px|right File:Map 1 twy.jpg|600px|c...") |
|||
| Line 9: | Line 9: | ||
=== Buildings === | === Buildings === | ||
| − | There are 527 buildings in Gombak. Some of the buildings are categorized into 7 main types namely clinic, constructions, garage, place of worship, public, residential and train station. Among the categorized buildings, the majority of it | + | There are 527 buildings in Gombak. Some of the buildings are categorized into 7 main types namely clinic, constructions, garage, place of worship, public, residential and train station. I have enlarged a portion of the map for easy viewing. Among the categorized buildings, the majority of it is residential. Many of the buildings remain un-categorized, so I categorized them under “others”. When building a CDQC, we need to ensure that it is away from buildings, as there are a large number of people in them, this is to prevent diseases spreading to the nearby population. The location of the buildings is crucial for making decision based on the health risk factor. |
=== Target Natural Features === | === Target Natural Features === | ||
| Line 16: | Line 16: | ||
=== Digital Elevation === | === Digital Elevation === | ||
When building the CDQC, we also need to take into consideration the ground elevation. From this model, the darker blue represents a higher ground elevation. We can see that the middle and bottom part of Gombak has quite a high elevation, with the highest ground elevation at 143m above sea levels. This plays a crucial role in making decisions based on economic factor. | When building the CDQC, we also need to take into consideration the ground elevation. From this model, the darker blue represents a higher ground elevation. We can see that the middle and bottom part of Gombak has quite a high elevation, with the highest ground elevation at 143m above sea levels. This plays a crucial role in making decisions based on economic factor. | ||
| + | |||
| + | == Map 2: Map layout of 4 views showing proximity to Roads, Buildings, Natural Features and the slope layer == | ||
| + | |||
| + | Before we can calculate the proximity (raster distance), we need to rasterize all the layers. We will first start by adding a new column(POI_CODE) in the attribute tables with value 1. With our rasterized layers, we can then compute the raster distance. | ||
| + | |||
| + | [[File:Map2 twy.jpg|600px|center]] | ||
| + | |||
| + | The grid values indicate distance away from the input layer in meters. | ||
| + | The black areas indicate a closer distance to the roads, while white areas show a distance of at least 300m to the roads. This applies to the other 2 views of buildings and natural features. | ||
| + | |||
| + | Slope analysis is calculated using the Raster Analysis --> Slope. The minimum slope is 0 degrees while the steepest is 36.4 degrees. Black areas of the map suggest 0 degree slope, meaning that it is on flat land, suitable for building our CDQC. | ||
| + | |||
| + | == Map 3: A map layout with four views showing the criterion scores of each factor layers == | ||
| + | |||
| + | I used the Min-Max standardization method, where the formula is : | ||
| + | [[File:Min-max formula twy.png|300px|center]] | ||
| + | |||
| + | [[File:Map 3 twy.jpg|600px|center]] | ||
| + | |||
| + | === Suitability of land depends on 4 factors: === | ||
| + | |||
| + | *'''Economic factor''' – no steep slope | ||
| + | *'''Accessibility factor''' – near targeted roads | ||
| + | *'''Health risk factor'''- away from buildings | ||
| + | *'''Natural conservation factor''' – away from natural features | ||
| + | |||
| + | 1 (red color) – represent better suitability of land | ||
| + | After standardization, roads that are further were given a higher standardized unit. Likewise, a higher steepness of slope was given a higher standardized unit. However, that is not what we want based on the criteria. Hence, I had to take (1-standardized value) to calculate criterion score for slope and roads so that '1' will represent better suitability of land across all the different layers for ease of viewing. | ||
| + | |||
| + | Each of the maps represents the recommended suitability based on that 1 chosen factor. However, since we have 4 different types of factors to consider, we will be using the AHP model to help us. | ||
| + | |||
| + | == Analytical Hierarchical Process input matrix == | ||
| + | [[File:AHP twy.jpg|600px|center]] | ||
| + | |||
| + | |||
| + | AHP is used when there are various factors to consider. In this case, I gave higher importance to health risk as compared to the rest as I believed a potential threat of disease spreading to residents in Gombak will result in national chaos, while since Singapore is a small country with land scarcity, natural conservation should not take precedence over important infrastructures like the CDQC. The AHP matrix helps to calculate the priority of the various factors. In this case, the factor with the highest priority is Health risk (55.8%) and the natural conservation factor (5.7%) is the lowest factor. | ||
| + | |||
| + | == Map 4: Suitability land lot(s) == | ||
| + | [[File:Map4 twy.jpg|600px|center]] | ||
| + | |||
| + | This shows the suitability percentage based on AHP results. I decided to base the suitability percentage at 80% on the potential choices. There are 2 potential options where we can build our CDQC, with Option1 having an area of 18284meters square, and Option2 having an area of 2380 meters square. Since the CDQC must be built with a contiguous area of at least 10,000m2, Option1 will be the best and most suitable choice. | ||
Latest revision as of 13:47, 10 November 2019
Contents
- 1 Map 1: Map Layout With 4 views showing Roads, Buildings, Natural Features and Digital Elevation
- 2 Map 2: Map layout of 4 views showing proximity to Roads, Buildings, Natural Features and the slope layer
- 3 Map 3: A map layout with four views showing the criterion scores of each factor layers
- 4 Analytical Hierarchical Process input matrix
- 5 Map 4: Suitability land lot(s)
Map 1: Map Layout With 4 views showing Roads, Buildings, Natural Features and Digital Elevation
Target Roads
Targeted roads: Service and tracks, is important for the transportation of construction materials during the building of the national Communicable Disease Quarantine Centre (CDQC). Therefore, it is important for the new location for CDQC to be near these roads. There are 186 service roads, the majority of them can be found in at the North-East side of Gombak (in Bukit Panjang camp). There are only 2 track roads, found at the South-West side of Gombak. The location of target roads is crucial when making the decision based on the accessibility factor.
Buildings
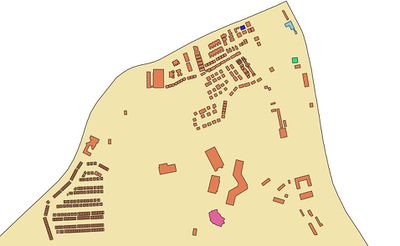
There are 527 buildings in Gombak. Some of the buildings are categorized into 7 main types namely clinic, constructions, garage, place of worship, public, residential and train station. I have enlarged a portion of the map for easy viewing. Among the categorized buildings, the majority of it is residential. Many of the buildings remain un-categorized, so I categorized them under “others”. When building a CDQC, we need to ensure that it is away from buildings, as there are a large number of people in them, this is to prevent diseases spreading to the nearby population. The location of the buildings is crucial for making decision based on the health risk factor.
Target Natural Features
There are 4 parks, 3 water bodies and 1 forest in Gombak. I have chosen to use intuitive colors to identify them on the map, forest is colored dark green, whereas parks and water bodies are colored light green and blue respectively. The location of the natural features is crucial for making decision based on the natural conservation factor.
Digital Elevation
When building the CDQC, we also need to take into consideration the ground elevation. From this model, the darker blue represents a higher ground elevation. We can see that the middle and bottom part of Gombak has quite a high elevation, with the highest ground elevation at 143m above sea levels. This plays a crucial role in making decisions based on economic factor.
Map 2: Map layout of 4 views showing proximity to Roads, Buildings, Natural Features and the slope layer
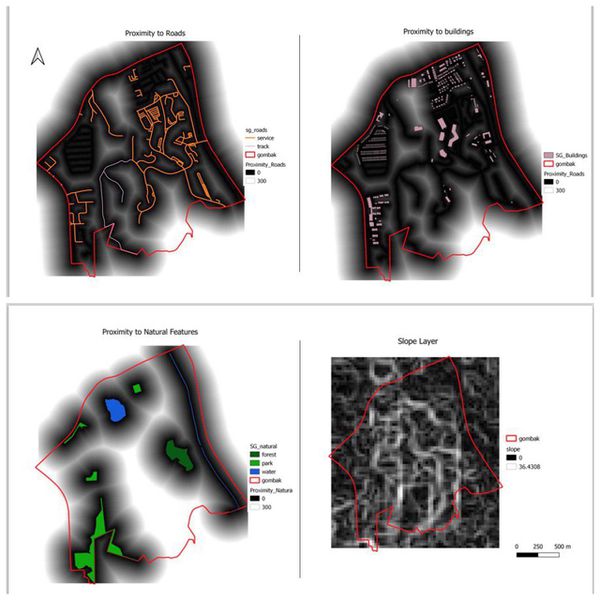
Before we can calculate the proximity (raster distance), we need to rasterize all the layers. We will first start by adding a new column(POI_CODE) in the attribute tables with value 1. With our rasterized layers, we can then compute the raster distance.
The grid values indicate distance away from the input layer in meters. The black areas indicate a closer distance to the roads, while white areas show a distance of at least 300m to the roads. This applies to the other 2 views of buildings and natural features.
Slope analysis is calculated using the Raster Analysis --> Slope. The minimum slope is 0 degrees while the steepest is 36.4 degrees. Black areas of the map suggest 0 degree slope, meaning that it is on flat land, suitable for building our CDQC.
Map 3: A map layout with four views showing the criterion scores of each factor layers
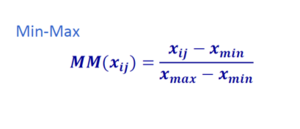
I used the Min-Max standardization method, where the formula is :
Suitability of land depends on 4 factors:
- Economic factor – no steep slope
- Accessibility factor – near targeted roads
- Health risk factor- away from buildings
- Natural conservation factor – away from natural features
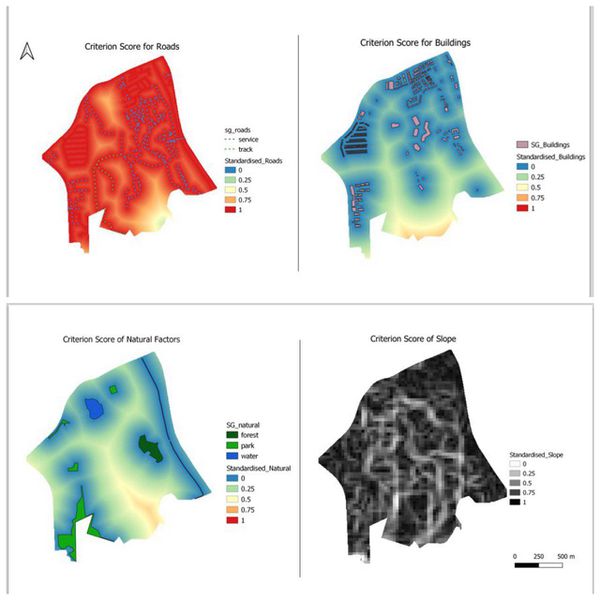
1 (red color) – represent better suitability of land After standardization, roads that are further were given a higher standardized unit. Likewise, a higher steepness of slope was given a higher standardized unit. However, that is not what we want based on the criteria. Hence, I had to take (1-standardized value) to calculate criterion score for slope and roads so that '1' will represent better suitability of land across all the different layers for ease of viewing.
Each of the maps represents the recommended suitability based on that 1 chosen factor. However, since we have 4 different types of factors to consider, we will be using the AHP model to help us.
Analytical Hierarchical Process input matrix
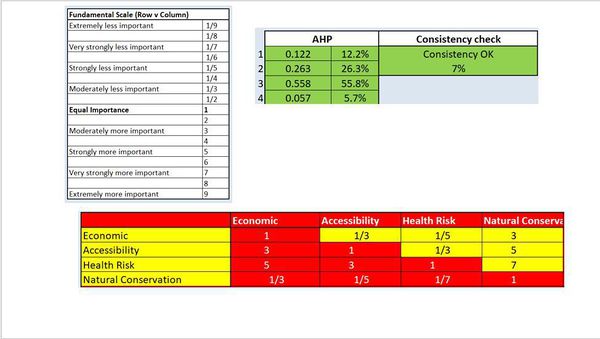
AHP is used when there are various factors to consider. In this case, I gave higher importance to health risk as compared to the rest as I believed a potential threat of disease spreading to residents in Gombak will result in national chaos, while since Singapore is a small country with land scarcity, natural conservation should not take precedence over important infrastructures like the CDQC. The AHP matrix helps to calculate the priority of the various factors. In this case, the factor with the highest priority is Health risk (55.8%) and the natural conservation factor (5.7%) is the lowest factor.
Map 4: Suitability land lot(s)
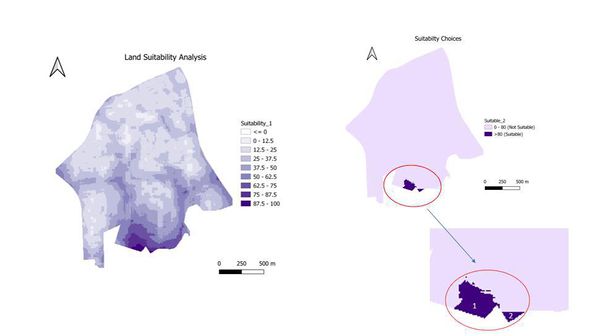
This shows the suitability percentage based on AHP results. I decided to base the suitability percentage at 80% on the potential choices. There are 2 potential options where we can build our CDQC, with Option1 having an area of 18284meters square, and Option2 having an area of 2380 meters square. Since the CDQC must be built with a contiguous area of at least 10,000m2, Option1 will be the best and most suitable choice.
