Difference between revisions of "SMT201 AY2019-20G1 EX2 Kok Su Yee"
| Line 96: | Line 96: | ||
<!--One of the criteria for the selected site has to be a contiguous area of at least 10,000m2. To fulfill this area size criterion, I have shortlisted 4 suitable lots by digitizing out the polygon features. These are the suggested location for building a national Communicable Disease Quarantine Centre in Gombak subzone. The area size of each suitable land lot are 10318.985m2, 10058.987m2, 10146.774m2, 10565.580m2 respectively as shown in the screenshot below. | <!--One of the criteria for the selected site has to be a contiguous area of at least 10,000m2. To fulfill this area size criterion, I have shortlisted 4 suitable lots by digitizing out the polygon features. These are the suggested location for building a national Communicable Disease Quarantine Centre in Gombak subzone. The area size of each suitable land lot are 10318.985m2, 10058.987m2, 10146.774m2, 10565.580m2 respectively as shown in the screenshot below. | ||
[[File:Suitable Sites Attribute Table (Su Yee).jpg|750px]] | [[File:Suitable Sites Attribute Table (Su Yee).jpg|750px]] | ||
| − | |||
<br> | <br> | ||
| − | + | Finally, I would recommend | |
[[File:Selection of Suitable Lot (Su Yee).png|1000px]]--> | [[File:Selection of Suitable Lot (Su Yee).png|1000px]]--> | ||
Revision as of 00:18, 10 November 2019
Contents
- 1 Part 1: Gombak Study Area Map layout with four views
- 2 Part 2: Proximity Map layout with four views
- 2.1 Accessibility Factor: Gombak Study area and proximity to target roads layer
- 2.2 Health Risk Factor: Gombak Study area and proximity to buildings layer
- 2.3 Natural Conservation Factor: Gombak Study area and proximity to target natural features layers
- 2.4 Economic Factor: Gombak Study area and slope layer
- 3 Part 3: Map layout with four views showing the criterion scores of each factor layers
- 4 Part 4: Analytical Hierarchical Process Input Matrix and Result Report
- 5 Part 5: Map layout with the Suitability Land Lot(s)
- 6 References
Part 1: Gombak Study Area Map layout with four views
In order to determine whether the location is suitable to build a national Communicable Disease Quarantine Centre, there are a few critical decision factors to take into consideration in this task: Economic, Accessibility, Health Risk and Natural Conservation. Since the selected site has to be at Gombak Planning Subzone, the following is the map layout that consists of four views in relation to the decision factors.

Accessibility Factor: Gombak Study area and the target roads
The target road types are service roads and tracks and the selected site has to be close to the existing local roads. Looking at the first view of the map, I have classified the road types into service roads and tracks. We can see that there is high accessibility of service road lines in the North and East side of the Gombak Subzone whereas the other parts of the Gombak does not have local roads to access. To ensure that there is no difficulty in transporting the building materials during the construction stage, the quarantine centre can be built in North eastern area of Gombak.
Health Risk Factor: Gombak Study area and buildings
Health risk factor plays a vital part when selecting the right location to build the quarantine centre so that it is located at far proximity from other buildings that are populated with many people. Considering this critical factor, it would be appropriate to build the quarantine centre at the Southern side of Gombak as there is no presence of buildings. The overall presence of the buildings is widely spread out at the Northern and Western part of Gombak so there are other available lands for us to select from.
Natural Conservation Factor: Gombak Study area and the target natural features
From this map view, it is apparent that there are not many natural features, namely forested land, park and water in Gombak Subzone. The natural conservation factor will not contribute a lot to selecting the suitable site since the. The natural feature types are represented by their own nature colours, green and blue in the map. In this case, there are available land at the Southern and Eastern areas of Gombak where there is no sight of natural features and it will be appropriate to construct the quarantine centre there.
Economic Factor: Gombak Study area and digital elevation
The selected site has to meet the economic factor where there is no steep slope in the vicinity and this to avoid incurring high development cost due to cut-and-fill activities. In this map view of digital elevation raster map, the highest value of elevation is 143 metres above the sea level. The highly elevated area is situated around Southern side of Gombak Subzone where it is coloured in white in that part and this area is suitable for building the quarantine centre.
Part 2: Proximity Map layout with four views
Proximity analysis is essential for us to define the best site location, it measures the distance between study area to the different factors layers. As a result, proximity maps are created to display the relations of the study area, Gombak Subzone in proximity with the different factors layers.

Accessibility Factor: Gombak Study area and proximity to target roads layer
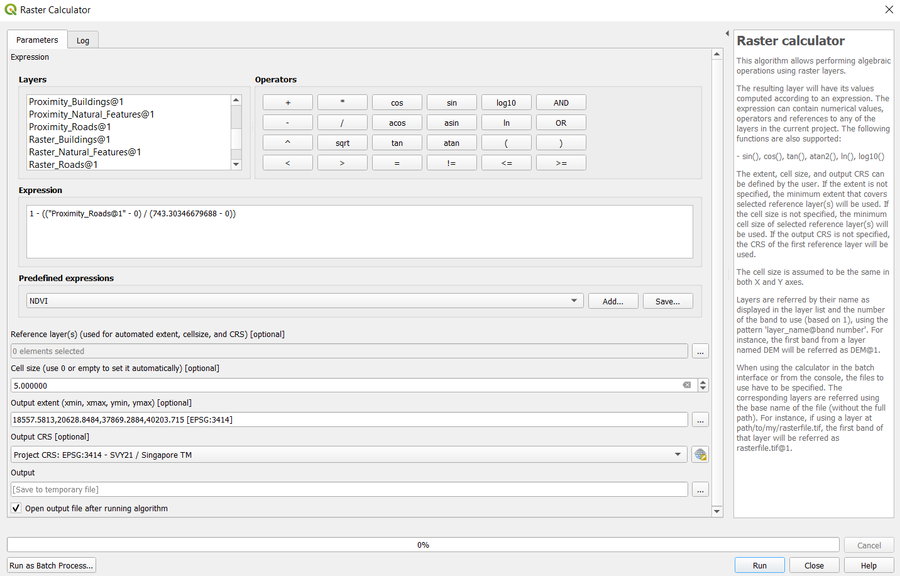
With the rasterised road layer to shows the proximity of the targets road to Gombak, it is clear that the minimum and maximum distance from the road are 0 and 743.303 metres respectively.
Health Risk Factor: Gombak Study area and proximity to buildings layer
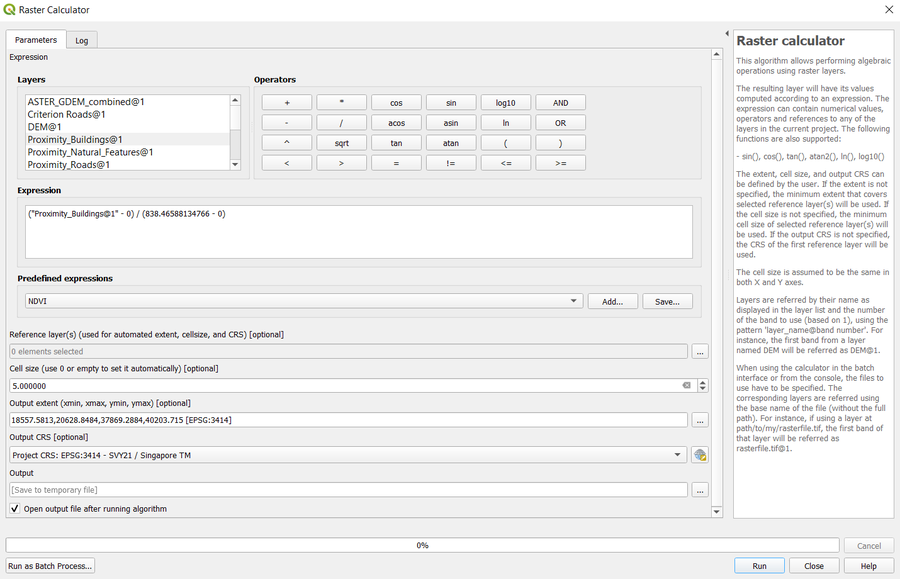
With the rasterised road layer to shows the proximity of the buildings to Gombak, it is clear that the minimum and maximum distance from the road are 0 and 838.446 metres respectively.
Natural Conservation Factor: Gombak Study area and proximity to target natural features layers
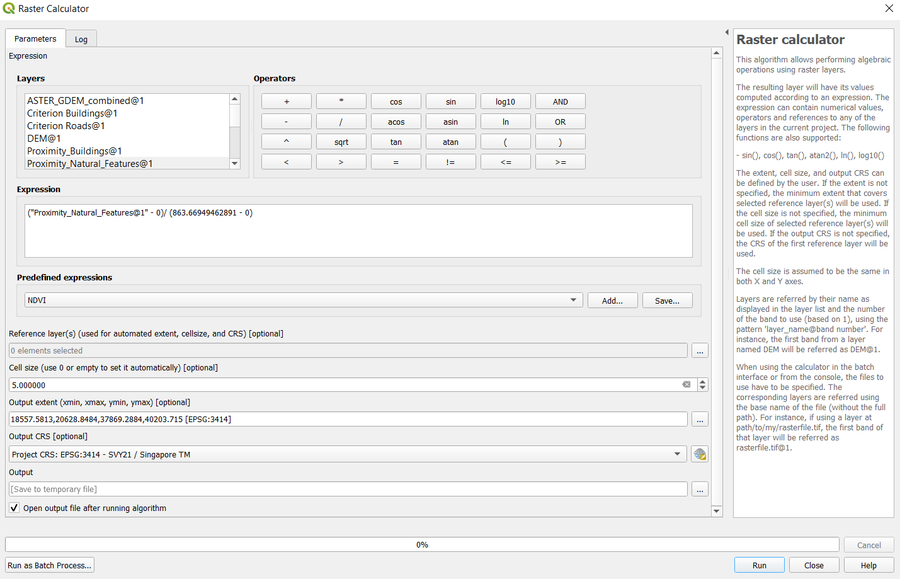
With the rasterised road layer to shows the proximity of the target natural features to Gombak, it is clear that the minimum and maximum distance from the road are 0 and 863.669 metres respectively.
Economic Factor: Gombak Study area and slope layer
The lowest degree for the slope layer is 0 and the highest degree is 36.419 degrees. The grids that has a darker grey intensity displays the locations with relatively gentle slope. Locations with steeper slope are indicated with lighter grey grids.
Part 3: Map layout with four views showing the criterion scores of each factor layers
The scale of measurement of the different factors layers proximity are currently different. Therefore, I uses the method of Min-Max criteria standardization techniques (𝑴𝑴(𝒙𝒊𝒋)=𝒙𝒊𝒋−𝒙𝒎𝒊𝒏𝒙𝒎𝒂𝒙−𝒙𝒎𝒊𝒏) to standardise all the factors and the criterion scores are calculated with the application of Raster Calculator in QGIS:
After setting up the various criterion scores, the map layout displaying the four views of these criterion scores is created:

- Economic factor
Minimum Value: 0
Maximum Value: 743.30346679688

The standardised score would mean that the higher the score, the degree of slope will get steeper. Hence, it would not be good to build the quarantine centre at the area marked as red colour where the score is high and it will involve a lot of cut-and-fill.
- Accessibility factor
Minimum Value: 0
Maximum Value: 838.46588134766

The higher the accessibility criterion score, the more suitable the land is to build the quarantine centre. Thus, the areas that are marked as blue are suitable to be selected since there are local road access for transporting the building materials.
- Health risk factor
Minimum Value: 0
Maximum Value: 863.66949462891

The higher the health risks criterion score, the less suitable the land is to build the quarantine centre. The areas that are indicated as red are not suitable to be selected.
- Natural conservation factor
Minimum Value: 0
Maximum Value:
36.419048309326

The higher the natural conservation criterion score, it means that the environment is highly surrounded by the forested land, parks and water. The chosen land for the quarantine centre should fall in the area marked as blue.
Part 4: Analytical Hierarchical Process Input Matrix and Result Report
 There are multiple objectives present and the requirement to fulfill the decision factors in choosing the most suitable land for the quarantine centre. I have computed a AHP (Analytical Hierarchical Process) Table which serve as a decision making tool in justifying the results from the factors and ensure the result produced is consistent. The AHP template is adopted from the Excel-based AHP library provided by SCB Associates. By inputting the level of importance for each factors into the pairwise comparison matrix as shown in the table above, it calculates the relative costs and values involved with the factors. The check of consistency, in this case which is 7%, is in an acceptable range. AHP prevents subjective judgement and makes the results more reliable.
In view of how I have computed the AHP Table, I have prioritized the factor of health risks to be the most important factors among the four factors and the AHP score is significantly high at 62%. This is because the amount of harm and negative impact caused to the society will be extremely detrimental if the disease become widely spread across the different locations if the location of the quarantine centre is poorly chosen and the people living in the nearby locations will be at a high risk getting into contact with the patients from the centre.
The second most important factor that is accessibility, the AHP score amounting up to 23.4%. Higher accessibility will lead to high efficiency of the construction work because the work involved in transporting the building materials is not complicated. If the location identified to build the quarantine centre have low access to the local roads, it will take longer for the construction workers to retrieve the building materials from the suppliers and transport it to the construction site. The time taken for transport could be better allocate for spending time on completing construction of the quarantine centre as early as possible. Moreover, in any case of emergency situations were to happen in the quarantine centre, help can be reached out to there easily if the location is accessible from the local and main roads.
Thirdly, natural conservation factor is important as well, scoring at 9.7%. This is so the natural features are preserved to protect the endangered wildlife and habitats. The natural features should be conserved and is vital for future usage.
Lastly, the developmental costs to be incurred that forms the economic factor is viewed as the least important among the other factors. The reason being that other factors can bring measurable harm and impact to lives due to poor location whereas this factor is valued in monetary terms. For that reason, it resulted in the lowest AHP score of 4.9%
Part 5: Map layout with the Suitability Land Lot(s)
After analysing the different map layouts of the Gombak study area and the target factor layers, as well as its proximity to them and also giving a criterion scores to each factors, it is time to evaluate the suitability of the land by leveraging on the AHP scores computed earlier.
Raster calculator is applied in QGIS to get the raster layer of suitable land lot and the results obtained are as shown in the screenshot below:
Reclassify values (simple) function is further applied in QGIS to classify the land into two binary classes, "Not Suitable" as 0 and "Not Suitable" as 1.
Thereafter, a new rasterised layer is created and I named it as the suitable lot. I applied the singleband pseudoccolor and selected the colour ramp of yellow-green to represent the 2 classes. This is so we can easily see and identify a suitable location to build the quarantine centre. From here, we can see that the suitable lot lies on the area that has a high intensity of green colour. -->
References
- Data Gov Master Plan 2014 Subzone Boundary " Master Plan 2014 Subzone Boundary"
- OpenStreetMap (OSM) Data sets " OpenStreetMap (OSM) Data sets"
- ASTER Global Digital Elevation Model (GDEM) Dataset "ASTER Global Digital Elevation Model (GDEM) Dataset"