Difference between revisions of "SMT201 AY2019-20T1 EX2 Kim Eugene"
| (6 intermediate revisions by the same user not shown) | |||
| Line 90: | Line 90: | ||
[[File:AHP_Table.JPG|900px|center|AHP_Table]] | [[File:AHP_Table.JPG|900px|center|AHP_Table]] | ||
| − | [[File:Consistency.JPG| | + | [[File:Consistency.JPG|300px|center|Consistency]] |
| Line 103: | Line 103: | ||
[[File:Suitability Analysis.png|600px|center|Suitability Analysis]] | [[File:Suitability Analysis.png|600px|center|Suitability Analysis]] | ||
| − | |||
| − | |||
=Part 5: Identified Suitable Land Lot= | =Part 5: Identified Suitable Land Lot= | ||
| Line 131: | Line 129: | ||
===== Selected Area 1 – Most Suitable ===== | ===== Selected Area 1 – Most Suitable ===== | ||
| − | [[File:landlot1.JPG| | + | [[File:landlot1.JPG|900px|center|landlot1]] |
This selected area is within the suitable land lot. It also meets the requirements of being a contiguous area of at least 10,000m^2. | This selected area is within the suitable land lot. It also meets the requirements of being a contiguous area of at least 10,000m^2. | ||
| Line 137: | Line 135: | ||
===== Selected Area 2 – Not Totally Suitable ===== | ===== Selected Area 2 – Not Totally Suitable ===== | ||
| − | [[File:landlot2.JPG| | + | [[File:landlot2.JPG|900px|center|landlot2]] |
This selected area is within the suitable land lot. However, it doesn’t meet the requirements of being a contiguous area of at least 10,000m^2. | This selected area is within the suitable land lot. However, it doesn’t meet the requirements of being a contiguous area of at least 10,000m^2. | ||
| Line 143: | Line 141: | ||
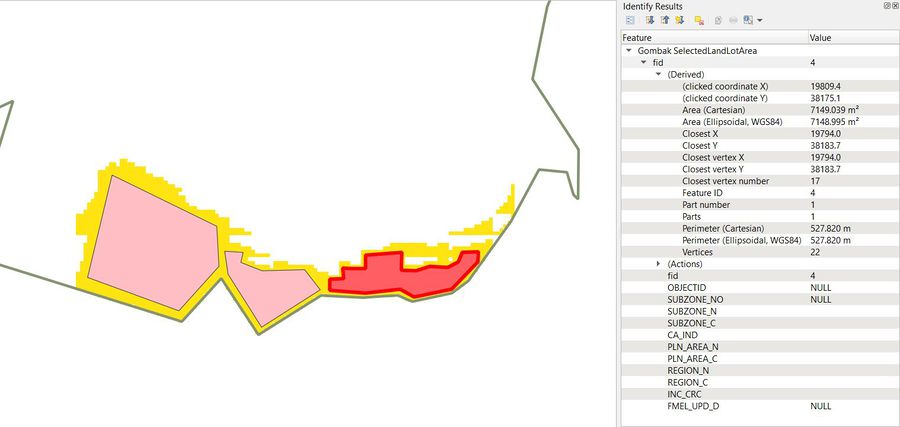
===== Selected Area 3 – Not Totally Suitable ===== | ===== Selected Area 3 – Not Totally Suitable ===== | ||
| − | [[File:landlot3.JPG| | + | [[File:landlot3.JPG|900px|center|landlot3]] |
| − | |||
| − | |||
| + | This selected area is within the suitable land lot. However, it doesn’t meet the requirements of being a contiguous area of at least 10,000m^2. Also, the shape of the area does not seem to be suitable for building a building. | ||
= Data Used & References = | = Data Used & References = | ||
Latest revision as of 20:18, 9 November 2019
Contents
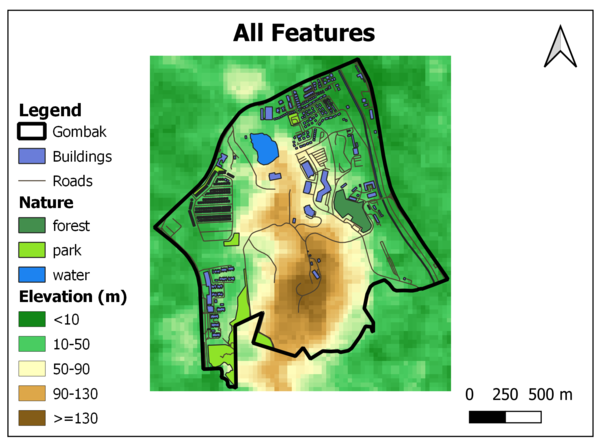
Part 1: Identifying Features in Gombak
In identifying the most suitable land lot for building a National Communicable Disease Quarantine Centre, the Economic Factor, Accessibility Factor, Health Risk Factor and Natural Conservation Factor will be considered.
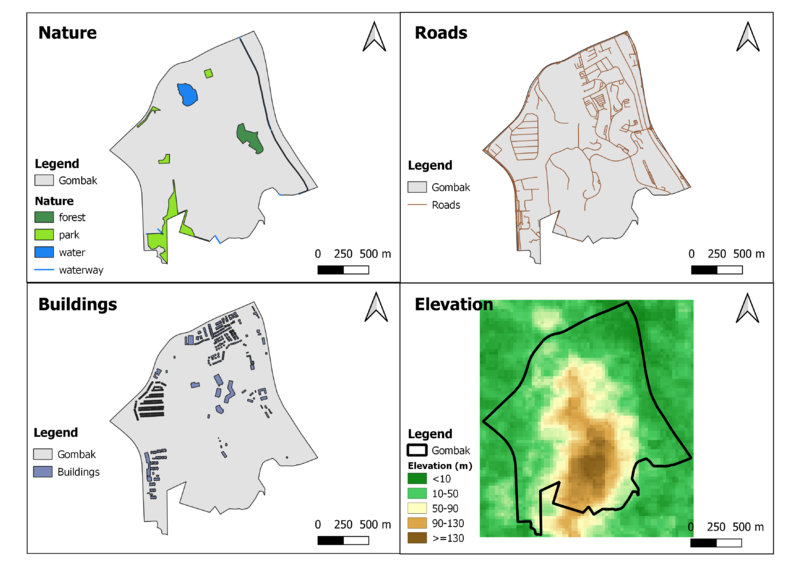
Nature in Gombak
Regarding the Natural Conservation Factor, the Quarantine Centre should be away from forests, parks and water/waterways. From the map layout showing the nature in Gombak, it is seen that majority of the land used as parks is located in the southwest part of Gombak. Nearer to the perimeter of the subzone, to the north there is area for water and to the east there are forests.
Roads in Gombak
Regarding the Accessibility Factor, the Quarantine Centre should be close to existing local roads to ensure easy transportation. From the map layout showing the roads in Gombak, there seems to be less road network in the south of Gombak.
Buildings in Gombak
Regarding the Health Risk Factor, the Quarantine Centre should be away from the population to avoid disease spreading. From the map layout of buildings in Gombak, it is identified that most of the buildings are located in the north and west parts of Gombak.
Elevation in Gombak
Regarding the Economic Factor, the selected site for the Quarantine Centre should avoid steep slope to reduce the development cost from having to cut-and-fill the land. From the map layout showing the elevation level in Gombak, the south and central part of Gombak is raised higher than the other parts of the subzone.
Part 2: Proximity to Features & Identifying Slopes
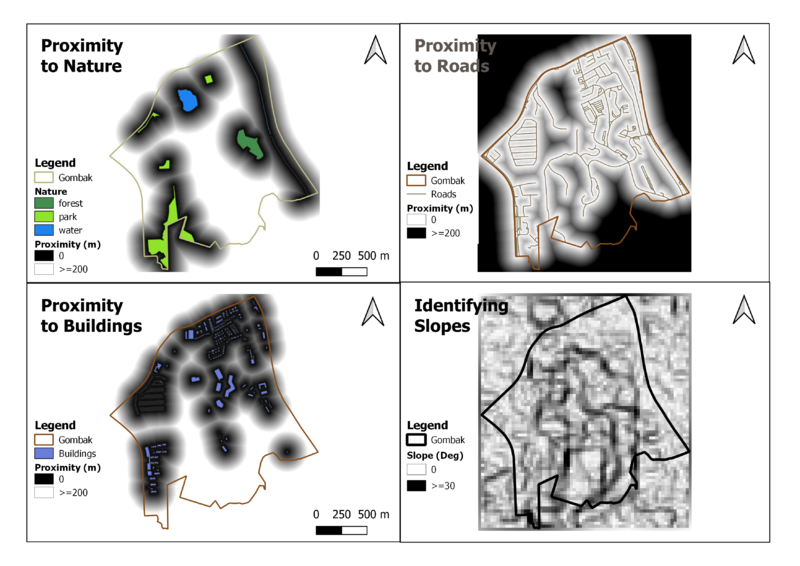
By rasterizing each features, further analysis (including proximity analysis and identifying slopes) can be carried out.
Proximity to Nature
The colour black is used to shade the areas that are within 200 meters rom the nature features. Thus, it would be inappropriate to build the Quarantine Centre in the areas shaded black as we don’t want the Centre to be close to nature features. Before manipulating the scale, values showed that the area that is supposedly the furthest away from all the nature features in Gombak (and within the set output extent) is 887.144 meters away.
Proximity to Roads
The colour black is used to shade the areas that are within 200 meters from the roads. Thus, it would be inappropriate to build the Quarantine Centre in the areas shaded completely black as it is too far away from the roads, lowering its accessibility. Before manipulating the scale, values showed that the area that is supposedly the furthest away from all the roads in Gombak (and within the set output extent) is 743.303 meters away.
Proximity to Buildings
The colour black is used to shade the areas that are within 200 meters from the buildings. Thus, it would be inappropriate to build the Quarantine Centre in the areas shaded black as is too close to the population. Before manipulating the scale, values showed that the area that is supposedly the furthest away from all the buildings in Gombak (and within the set output extent) is 844.038 meters away.
Identifying Slopes
The colour black is used to shade the areas with slopes higher than 30 degrees. Thus, it would be inappropriate to build the Quarantine Centre in the areas shaded completely black as is too steep to build the Quarantine Centre. Before manipulating the scale, values showed that the area that has the highest slope in Gombak (and within the set output extent) has a slope of 36.4087 degrees.
Part 3: Criterion Scores
I) Calculating the Criteria Standardization Scores
| Raster Layer Name | Min | Max |
|---|---|---|
| Proximity_Nature | 0 | 887.144 |
| Proximity_Roads | 0 | 743.303 |
| Proximity_Buildings | 0 | 844.038 |
| Slope | 0 | 36.4087 |
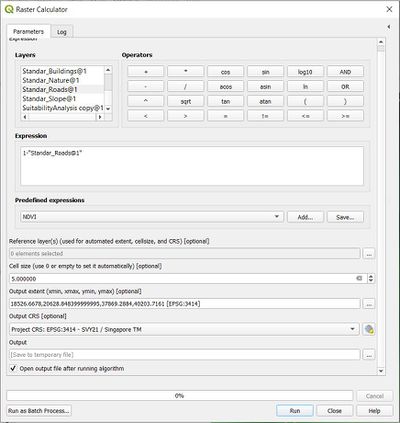
Using the Min-Max Criteria Standardization Technique, the scores for each of the raster layers were standardized to values from 0 to 1.
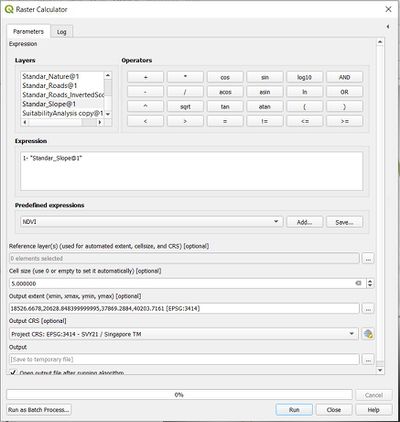
Then, as I was going to combine all the raster layers together to find the most suitable land lot, I had to standardize the what the values from 0 to 1 represented. Closer the score is to the value 0, the less suitable the land will be and closer the score is to the value 1, the more suitable the land will be for the Quarantine Centre to be built. This was done by inverting the standardized scores for the Proximity to Road and Degree of Slope (as shown in the screenshots below).
II) Final Map Layout + Descriptions
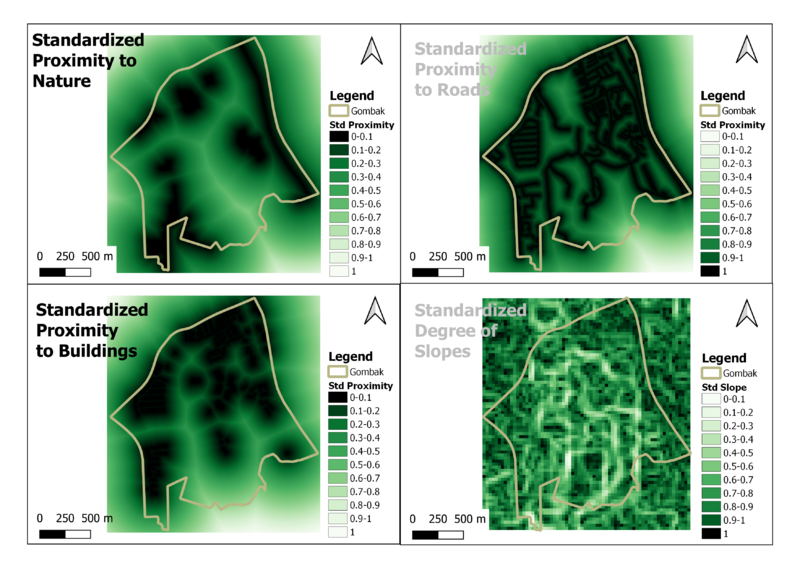
Standardized Proximity to Nature
Closer the score is to 0, the less suitable the area is for building the CDQC as it is closer to nature.
Standardized Proximity to Road
Closer the score is to 0, the less suitable the area is for building the CDQC as it is further away from the roads.
Standardized Proximity to Buildings
Closer the score is to 0, the less suitable the land is for building the CDQC as it is closer to the population.
Standardized Degree of Slopes
Closer the score is to 0, the less suitable the land is for building the CDQC as it has a steeper slope.
Part 4: AHP
I) AHP Input Matrix
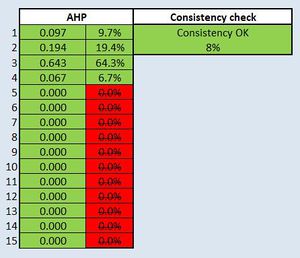
Below shows the Analytical Hierarchical Process input matrix as well as its results. Health Risk factor was highly prioritized above any other factors to prevent unwanted spreading of the diseases to the population. Then, the Accessibility factor was prioritized, followed by Economic factor and Nature Conservation factor. The consistency of the AHP was 8%.
II) Factoring in AHP Scores
Below shows how the AHP scores were factored into when combining the 4 standardized raster layers. The raster calculator was used.
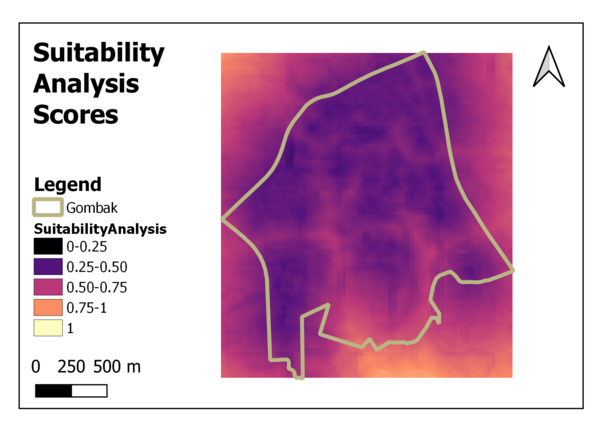
The map layout of the resulting raster layer is shown below.
Part 5: Identified Suitable Land Lot
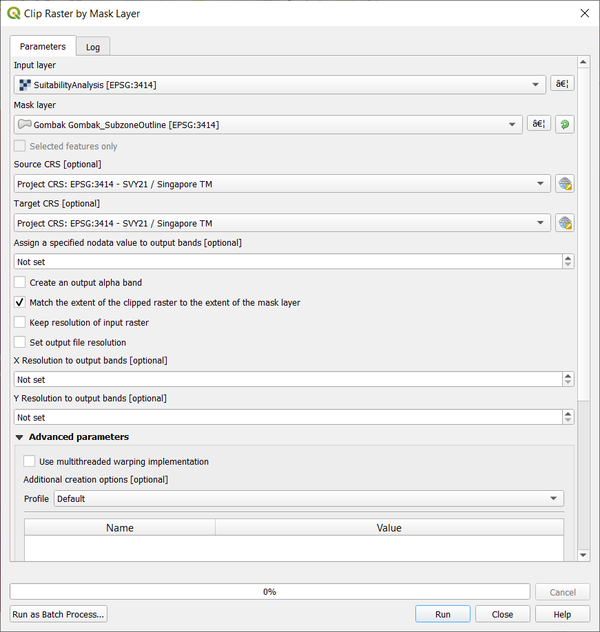
To find the most suitable land lot within Gombak, the combined raster layer of all the standardized & scored raster layers was clipped.
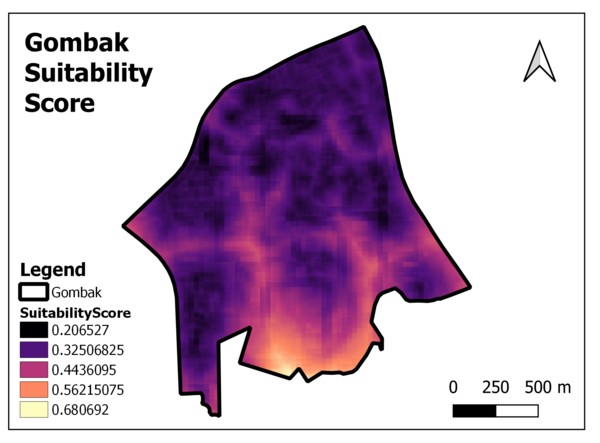
After clipping the raster layer for the Gombak subzone, I found that the suitability scores of the raster layer only ranged from 0.206527 to 0.68069.
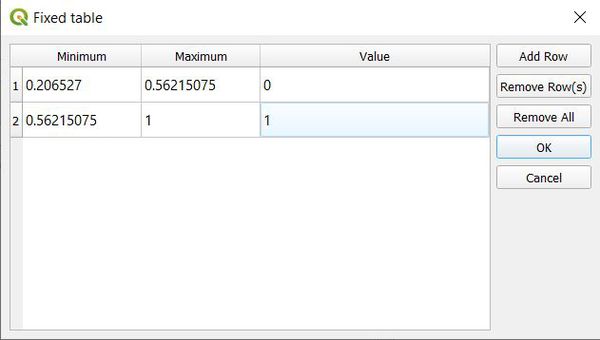
I wanted to identify the areas that have the top 25% scores and use those areas to select the suitable land lots. Therefore, the following calculation was used to find that areas that have the score of 0.56215075 and above will be the area of interest.
Top 25% Scores >= 0.206527 + (0.68069 - 0.206527) * 0.75
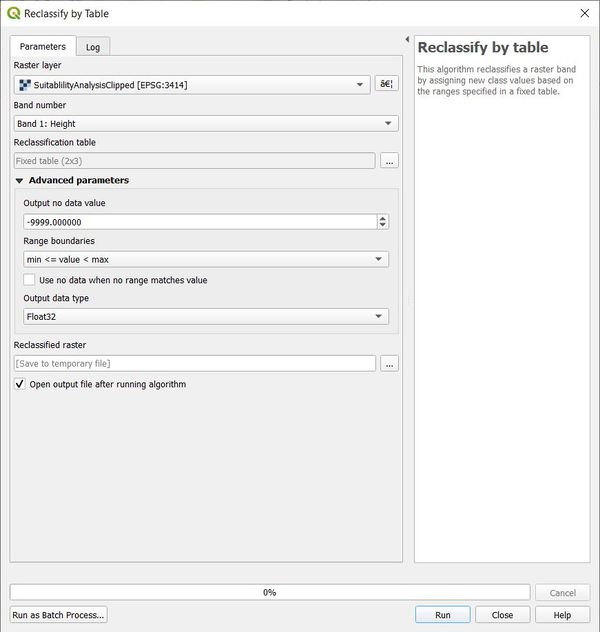
Then, I reclassified the raster layer accordingly, 0.206527<= score < 0.56215075 given the value 0 (unsuitable area) and 0.56215075<= score < 1 given the value 1 (suitable area).
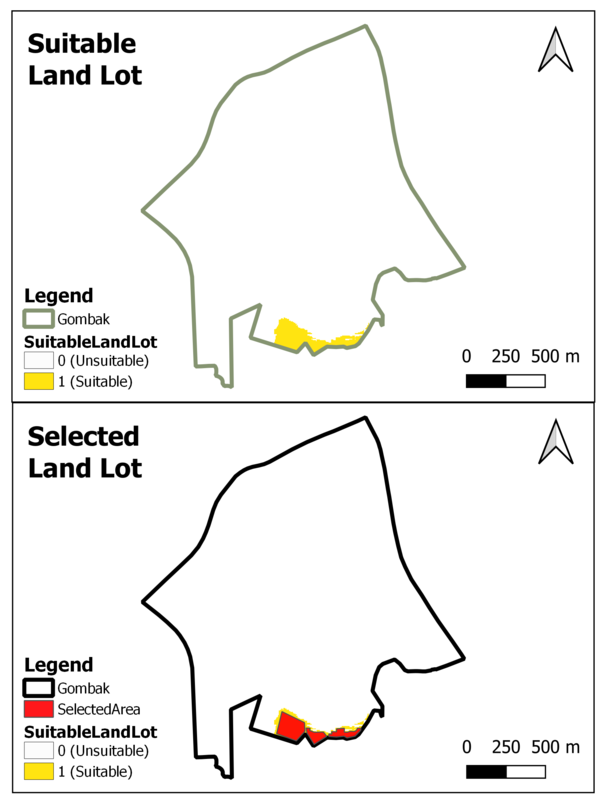
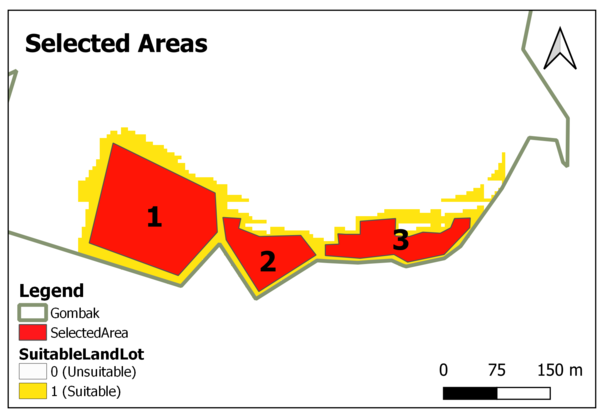
After the reclassifying the raster layer, 3 different land lots were selected within the suitable area (shaded yellow).
Selected Area 1 – Most Suitable
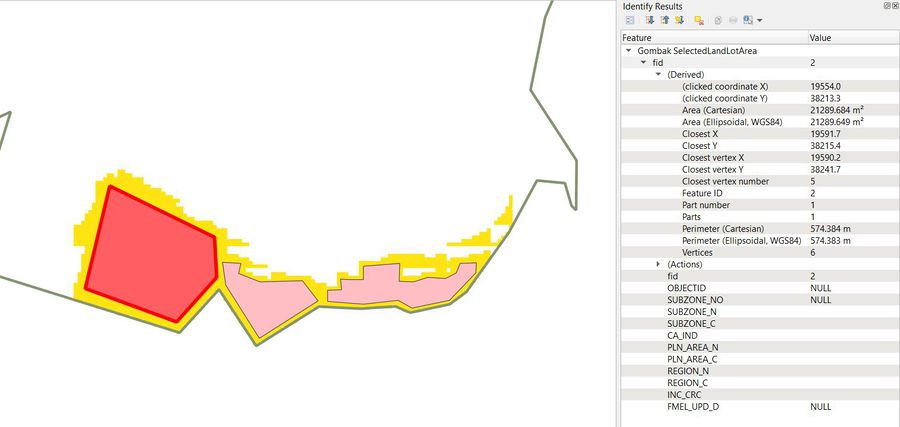
This selected area is within the suitable land lot. It also meets the requirements of being a contiguous area of at least 10,000m^2.
Selected Area 2 – Not Totally Suitable
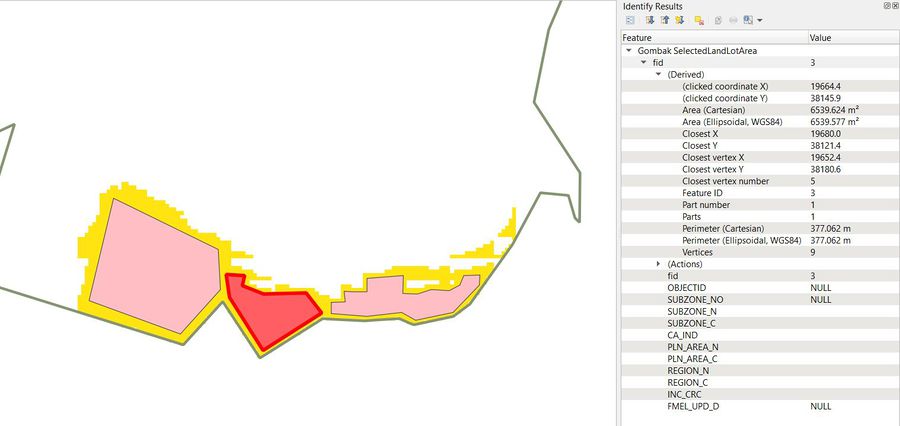
This selected area is within the suitable land lot. However, it doesn’t meet the requirements of being a contiguous area of at least 10,000m^2.
Selected Area 3 – Not Totally Suitable
This selected area is within the suitable land lot. However, it doesn’t meet the requirements of being a contiguous area of at least 10,000m^2. Also, the shape of the area does not seem to be suitable for building a building.
Data Used & References
- MasterPlan2014 Subzone Boundary - www.data.gov.sg
- Different Features from OSM - https://www.bbbike.org/Singapore/
- GDEM Data Set - https://search.earthdata.nasa.gov/search?m=-7.175!25.59375!1!1!0!0%2C2
- AHP Template – SCB Associates
