Difference between revisions of "SMT201 AY2019-20G1 EX2 Lin Xing"
Jump to navigation
Jump to search


| Line 1: | Line 1: | ||
| + | [[File:Calculated weightage.png|600px|center]] | ||
| + | [[File:AHP calculation.png|600px|center]] | ||
| + | [[File:Output.jpg |600px|center]] | ||
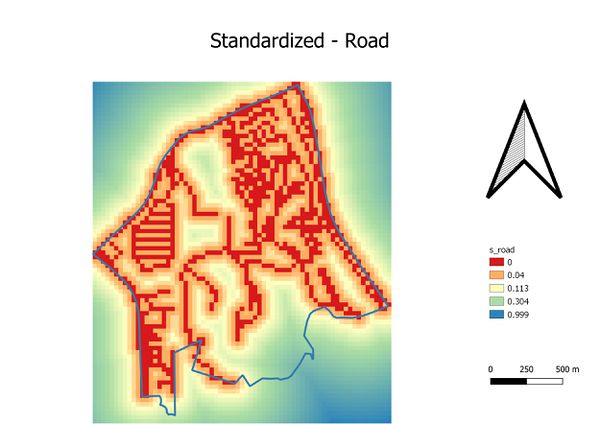
| − | + | [[File:S road.jpg |600px|center]] | |
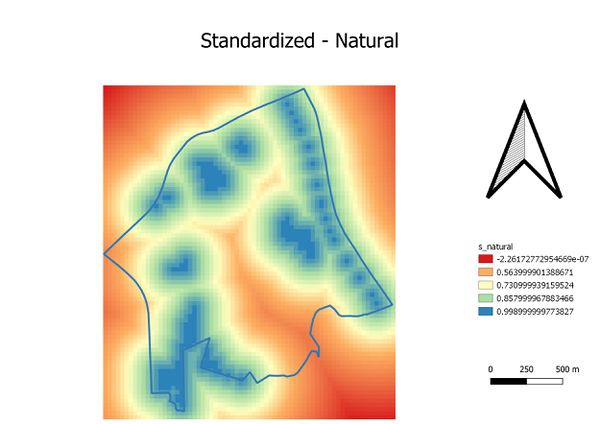
| − | + | [[File:S natural.jpg|600px|center]] | |
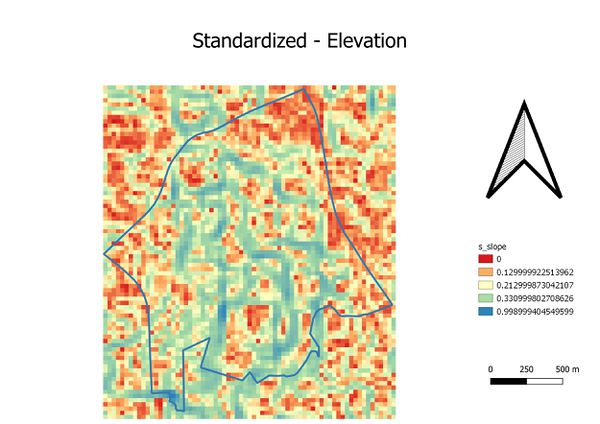
| − | [[File: | + | [[File:S elevation.jpg|600px|center]] |
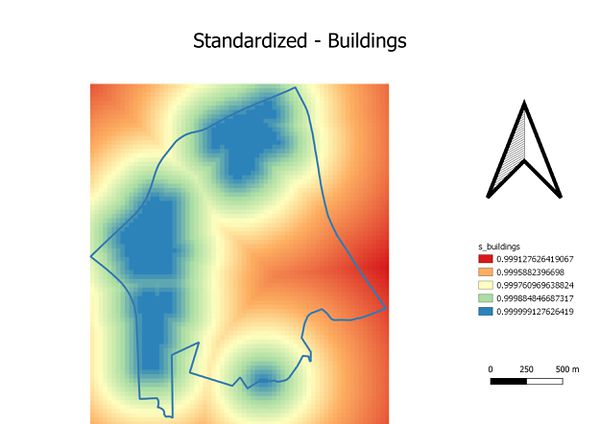
| − | + | [[File:S buildings.jpg|600px|center]] | |
| − | |||
| − | |||
| − | |||
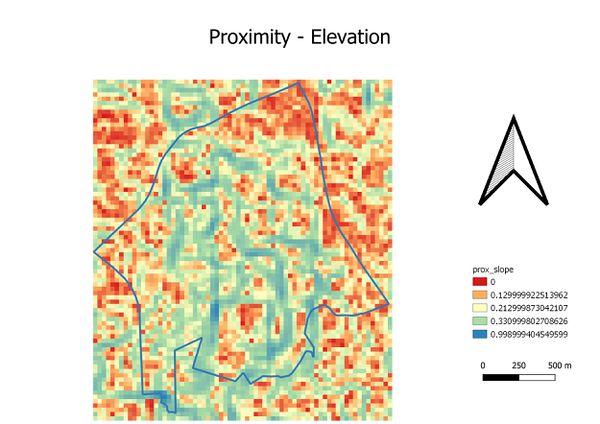
| − | + | [[File:Prox slope.jpg|600px|center]] | |
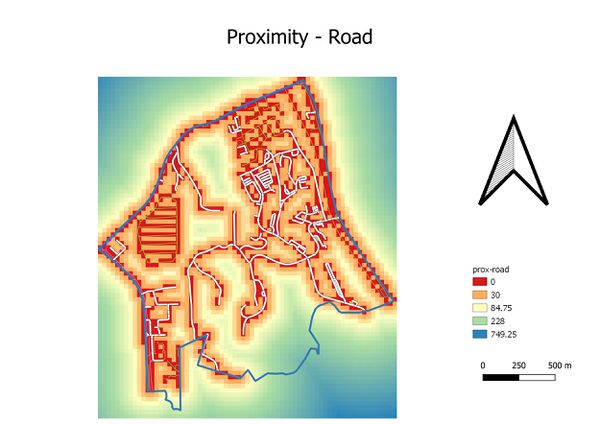
| − | [[File: | + | [[File:Prox road.jpg|600px|center]] |
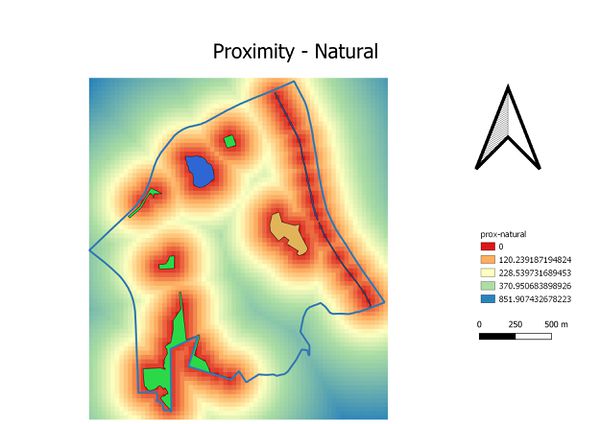
| − | + | [[File:Prox natural1.jpg|600px|center]] | |
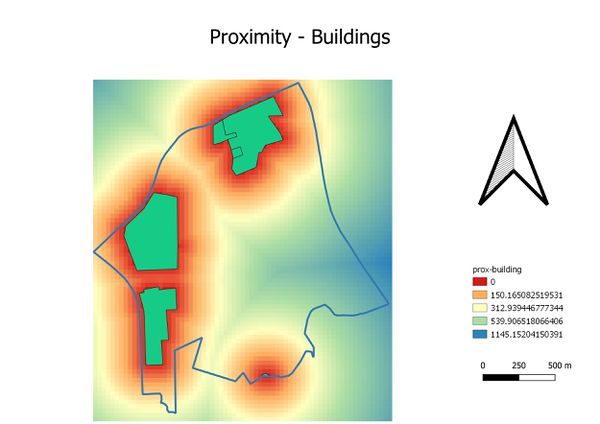
| + | [[File:Prox building.jpg|600px|center]] | ||
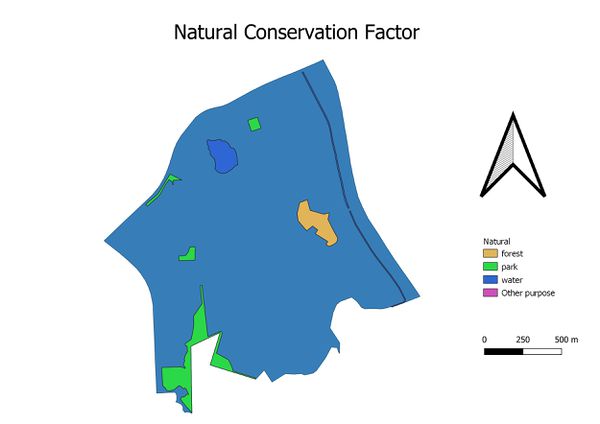
| − | + | [[File:Visual analysis natural.jpg|600px|center]] | |
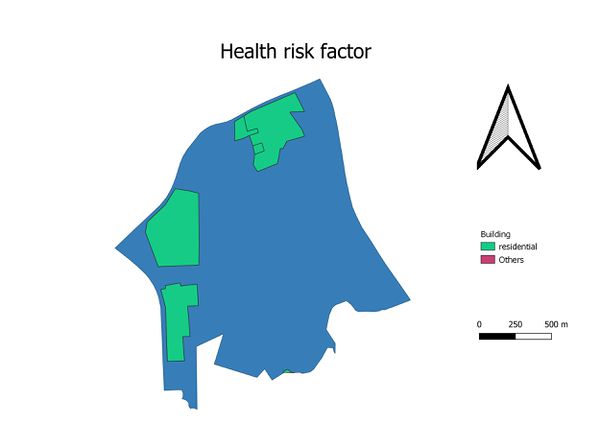
| − | + | [[File:Visual analysis health risk factor.jpg|600px|center]] | |
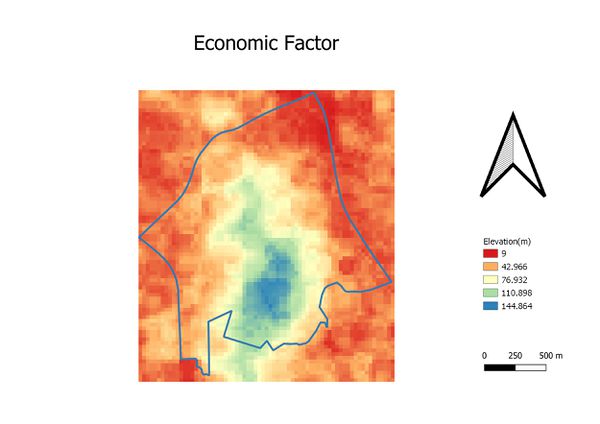
| − | + | [[File:Visual analysis Elevation.jpg|600px|center]] | |
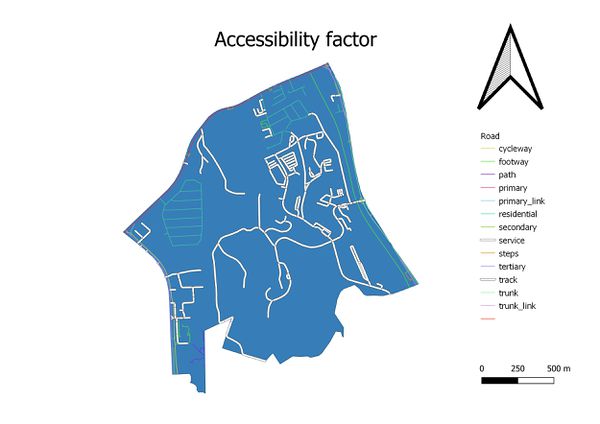
| − | + | [[File:Visual analysis accessibility factor.jpg|600px|center]] | |
| − | |||
| − | |||
| − | |||
| − | |||
| − | |||
| − | |||
| − | |||
| − | |||
| − | |||
| − | |||
| − | [[File: | ||
| − | |||
| − | [[File: | ||
| − | |||
| − | |||
| − | |||
| − | [[File: | ||
| − | |||
| − | [[File: | ||
| − | |||
| − | |||
| − | |||
| − | |||
| − | |||
| − | |||
| − | |||
| − | |||
Revision as of 14:31, 9 November 2019


