Difference between revisions of "SMT201 AY2019-20G1 Ex2 Lim Shen Jie"
| Line 3: | Line 3: | ||
==== Description ==== | ==== Description ==== | ||
The cartographic technique used to categorize the schools by their main_level was hue. That is because the main_level attribute is a nominal data. Point symbols are the best for schools because it would be able to pinpoint their exact location. | The cartographic technique used to categorize the schools by their main_level was hue. That is because the main_level attribute is a nominal data. Point symbols are the best for schools because it would be able to pinpoint their exact location. | ||
| − | |||
| − | |||
| − | |||
| − | |||
== Part 2: Raster view of the study areas == | == Part 2: Raster view of the study areas == | ||
| Line 12: | Line 8: | ||
==== Description ==== | ==== Description ==== | ||
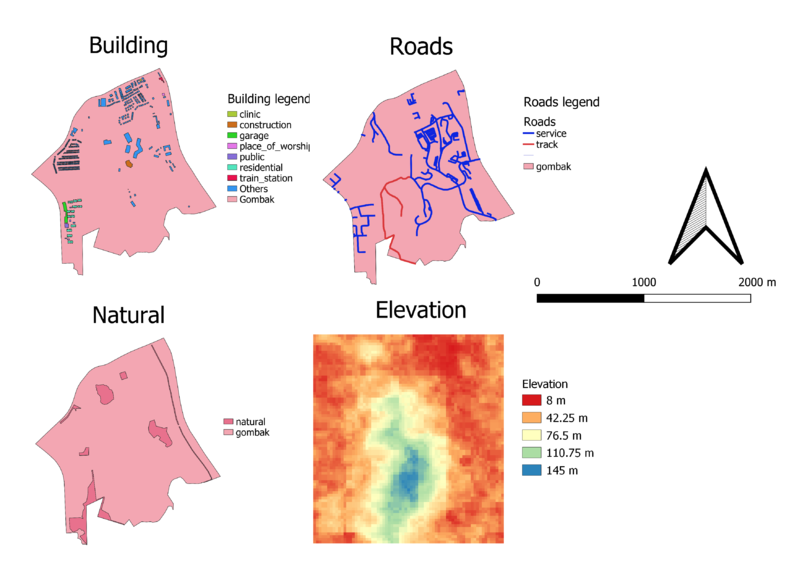
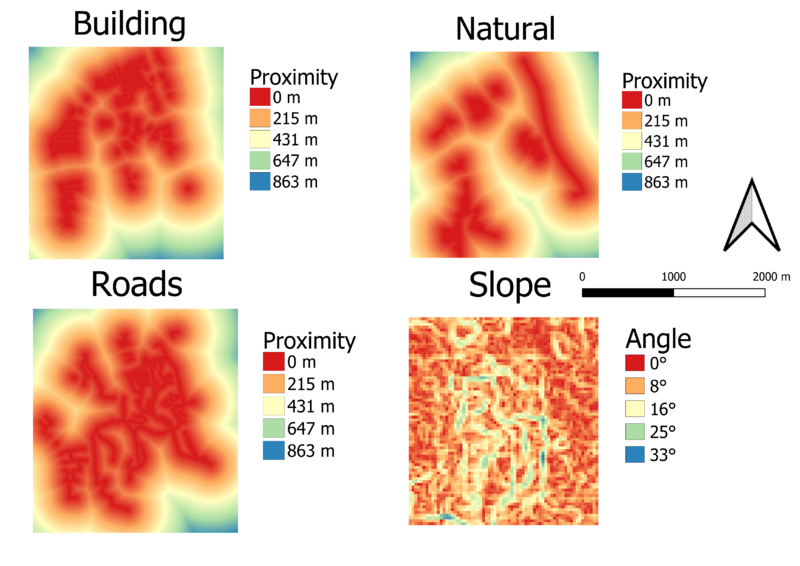
As the roads were not categorized by their road type, a calculated field was needed to generate the road type for the roads based on the name of the road. The cartographic technique used to categorize the roads by the RD_DESC was hue. That is because the RD_DESC data is nominal. To represent the roads on the map, lines are the best way to pinpoint the exact location of the roads. | As the roads were not categorized by their road type, a calculated field was needed to generate the road type for the roads based on the name of the road. The cartographic technique used to categorize the roads by the RD_DESC was hue. That is because the RD_DESC data is nominal. To represent the roads on the map, lines are the best way to pinpoint the exact location of the roads. | ||
| − | |||
| − | |||
| − | |||
| − | |||
== Part 3: Raster view showing the criterion scores of the study areas == | == Part 3: Raster view showing the criterion scores of the study areas == | ||
| Line 31: | Line 23: | ||
==== Discussion ==== | ==== Discussion ==== | ||
| − | ==== Sources ==== | + | ===== Sources ===== |
| − | 1. [https://data.gov.sg/dataset/master-plan- | + | 1. [https://data.gov.sg/dataset/master-plan-2014-subzone-boundary-no-sea Master Plan 2014 Subzone (No Sea)] |
| − | 2. [https:// | + | 2. [https://www.bbbike.org/Singapore/ BBBike@Singapore] |
| − | 3. [https:// | + | 3. [https://search.earthdata.nasa.gov/search?m=-7.175!25.59375!1!1!0!0%2C2 ASTER Global Digital Elevation Model (GDEM) dataset] |
Revision as of 13:51, 9 November 2019
Contents
Part 1: Standard view of study areas
Description
The cartographic technique used to categorize the schools by their main_level was hue. That is because the main_level attribute is a nominal data. Point symbols are the best for schools because it would be able to pinpoint their exact location.
Part 2: Raster view of the study areas
Description
As the roads were not categorized by their road type, a calculated field was needed to generate the road type for the roads based on the name of the road. The cartographic technique used to categorize the roads by the RD_DESC was hue. That is because the RD_DESC data is nominal. To represent the roads on the map, lines are the best way to pinpoint the exact location of the roads.
Part 3: Raster view showing the criterion scores of the study areas
Part 4: AHP tables
Description
The number of people that were older than 65 years increased from 2010 to 2018
Part 5: Suitable land
Discussion
Sources
1. Master Plan 2014 Subzone (No Sea) 2. BBBike@Singapore 3. ASTER Global Digital Elevation Model (GDEM) dataset


