Difference between revisions of "SMT201 AY2019-20G2 Ex2 JerryTohvan"
| Line 171: | Line 171: | ||
== Analytical Hierarchical Process Input Matrix & Approach == | == Analytical Hierarchical Process Input Matrix & Approach == | ||
[[File:AHP Scale.jpg|300px|center]] | [[File:AHP Scale.jpg|300px|center]] | ||
| + | <p class=MsoNormal align=center style='text-align:center;line-height:normal'><span | ||
| + | lang=EN-GB style='font-size:8.0pt;font-family:"Times New Roman",serif; | ||
| + | mso-fareast-font-family:"Times New Roman";font-variant:small-caps;color:white'><span | ||
| + | style='color:windowtext'>FIGURE XIV</span></span></p> | ||
| + | <p class=MsoNormal align=center style='text-align:center;line-height:normal'><span | ||
| + | lang=EN-GB style='font-size:8.0pt;font-family:"Times New Roman",serif; | ||
| + | mso-fareast-font-family:"Times New Roman";font-variant:small-caps;color:white'><span | ||
| + | style='color:windowtext'>SCB Associates' AHP Scoring Framework</span></span></p> | ||
| + | <br> | ||
| + | |||
[[File:Pairwise Comparison Matrix.jpg|300px|center]] | [[File:Pairwise Comparison Matrix.jpg|300px|center]] | ||
| + | <p class=MsoNormal align=center style='text-align:center;line-height:normal'><span | ||
| + | lang=EN-GB style='font-size:8.0pt;font-family:"Times New Roman",serif; | ||
| + | mso-fareast-font-family:"Times New Roman";font-variant:small-caps;color:white'><span | ||
| + | style='color:windowtext'>FIGURE XV</span></span></p> | ||
| + | <p class=MsoNormal align=center style='text-align:center;line-height:normal'><span | ||
| + | lang=EN-GB style='font-size:8.0pt;font-family:"Times New Roman",serif; | ||
| + | mso-fareast-font-family:"Times New Roman";font-variant:small-caps;color:white'><span | ||
| + | style='color:windowtext'>AHP Scoring Framework for Accounting Factors</span></span></p> | ||
| + | <br> | ||
| + | |||
[[File:AHP Analysis.jpg|300px|center]] | [[File:AHP Analysis.jpg|300px|center]] | ||
[[File:AHP Analysis 2.jpg|300px|center]] | [[File:AHP Analysis 2.jpg|300px|center]] | ||
[[File:AHP Ratio.jpg|300px|center]] | [[File:AHP Ratio.jpg|300px|center]] | ||
| + | <p class=MsoNormal align=center style='text-align:center;line-height:normal'><span | ||
| + | lang=EN-GB style='font-size:8.0pt;font-family:"Times New Roman",serif; | ||
| + | mso-fareast-font-family:"Times New Roman";font-variant:small-caps;color:white'><span | ||
| + | style='color:windowtext'>FIGURE XVI</span></span></p> | ||
| + | <p class=MsoNormal align=center style='text-align:center;line-height:normal'><span | ||
| + | lang=EN-GB style='font-size:8.0pt;font-family:"Times New Roman",serif; | ||
| + | mso-fareast-font-family:"Times New Roman";font-variant:small-caps;color:white'><span | ||
| + | style='color:windowtext'>AHP Results</span></span></p> | ||
| + | <br> | ||
[[File:Raster calc AHP.jpg|300px|center]] | [[File:Raster calc AHP.jpg|300px|center]] | ||
| + | <p class=MsoNormal align=center style='text-align:center;line-height:normal'><span | ||
| + | lang=EN-GB style='font-size:8.0pt;font-family:"Times New Roman",serif; | ||
| + | mso-fareast-font-family:"Times New Roman";font-variant:small-caps;color:white'><span | ||
| + | style='color:windowtext'>FIGURE XVII</span></span></p> | ||
| + | <p class=MsoNormal align=center style='text-align:center;line-height:normal'><span | ||
| + | lang=EN-GB style='font-size:8.0pt;font-family:"Times New Roman",serif; | ||
| + | mso-fareast-font-family:"Times New Roman";font-variant:small-caps;color:white'><span | ||
| + | style='color:windowtext'>Weighing AHP Scores into QGIS Raster Calculator</span></span></p> | ||
| + | <br> | ||
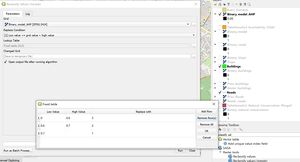
[[File:Reclassify binary AHP.jpg|300px|center]] | [[File:Reclassify binary AHP.jpg|300px|center]] | ||
| + | <p class=MsoNormal align=center style='text-align:center;line-height:normal'><span | ||
| + | lang=EN-GB style='font-size:8.0pt;font-family:"Times New Roman",serif; | ||
| + | mso-fareast-font-family:"Times New Roman";font-variant:small-caps;color:white'><span | ||
| + | style='color:windowtext'>FIGURE XVIII</span></span></p> | ||
| + | <p class=MsoNormal align=center style='text-align:center;line-height:normal'><span | ||
| + | lang=EN-GB style='font-size:8.0pt;font-family:"Times New Roman",serif; | ||
| + | mso-fareast-font-family:"Times New Roman";font-variant:small-caps;color:white'><span | ||
| + | style='color:windowtext'>Reclassifying Raster Values using SAGA's Plugin for Degrees of Suitability</span></span></p> | ||
| + | <br> | ||
| + | |||
== Recommendation == | == Recommendation == | ||
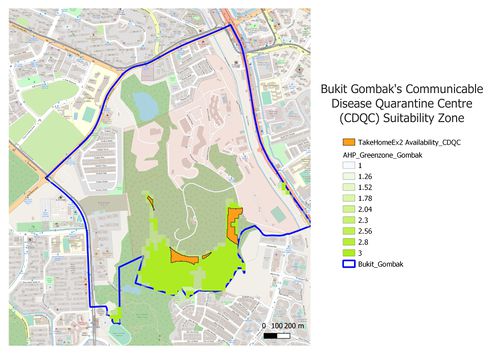
[[File:Suitability map overview.jpg|500px|center]] | [[File:Suitability map overview.jpg|500px|center]] | ||
| + | <p class=MsoNormal align=center style='text-align:center;line-height:normal'><span | ||
| + | lang=EN-GB style='font-size:8.0pt;font-family:"Times New Roman",serif; | ||
| + | mso-fareast-font-family:"Times New Roman";font-variant:small-caps;color:white'><span | ||
| + | style='color:windowtext'>FIGURE XIX</span></span></p> | ||
| + | <p class=MsoNormal align=center style='text-align:center;line-height:normal'><span | ||
| + | lang=EN-GB style='font-size:8.0pt;font-family:"Times New Roman",serif; | ||
| + | mso-fareast-font-family:"Times New Roman";font-variant:small-caps;color:white'><span | ||
| + | style='color:windowtext'>Suitability Map Overview</span></span></p> | ||
| + | <br> | ||
| + | |||
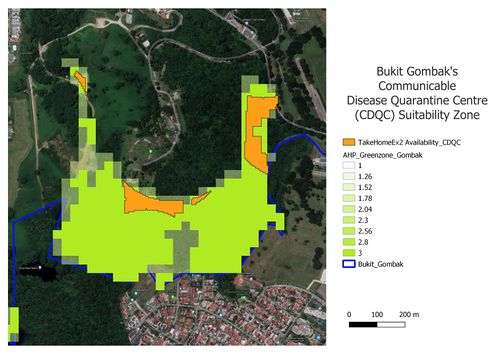
[[File:Suitability map zoomed.jpg|500px|center]] | [[File:Suitability map zoomed.jpg|500px|center]] | ||
| + | <p class=MsoNormal align=center style='text-align:center;line-height:normal'><span | ||
| + | lang=EN-GB style='font-size:8.0pt;font-family:"Times New Roman",serif; | ||
| + | mso-fareast-font-family:"Times New Roman";font-variant:small-caps;color:white'><span | ||
| + | style='color:windowtext'>FIGURE XX</span></span></p> | ||
| + | <p class=MsoNormal align=center style='text-align:center;line-height:normal'><span | ||
| + | lang=EN-GB style='font-size:8.0pt;font-family:"Times New Roman",serif; | ||
| + | mso-fareast-font-family:"Times New Roman";font-variant:small-caps;color:white'><span | ||
| + | style='color:windowtext'>Qualitative Analysis: Zooming into Possible Region Using Google's Satelitte</span></span></p> | ||
| + | <br> | ||
| + | |||
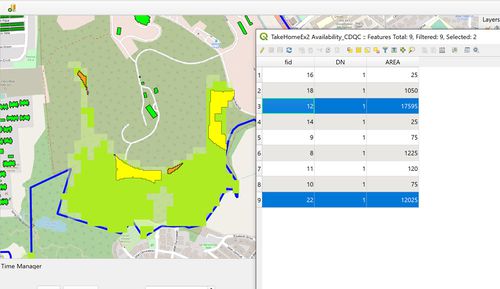
[[File:Recommendation Area.jpg|500px|center]] | [[File:Recommendation Area.jpg|500px|center]] | ||
| + | <p class=MsoNormal align=center style='text-align:center;line-height:normal'><span | ||
| + | lang=EN-GB style='font-size:8.0pt;font-family:"Times New Roman",serif; | ||
| + | mso-fareast-font-family:"Times New Roman";font-variant:small-caps;color:white'><span | ||
| + | style='color:windowtext'>FIGURE XXI</span></span></p> | ||
| + | <p class=MsoNormal align=center style='text-align:center;line-height:normal'><span | ||
| + | lang=EN-GB style='font-size:8.0pt;font-family:"Times New Roman",serif; | ||
| + | mso-fareast-font-family:"Times New Roman";font-variant:small-caps;color:white'><span | ||
| + | style='color:windowtext'>Making Recommendation based on Availibity of Land</span></span></p> | ||
| + | <br> | ||
Revision as of 00:14, 4 November 2019
Contents
Part 1: Study Area Map Components
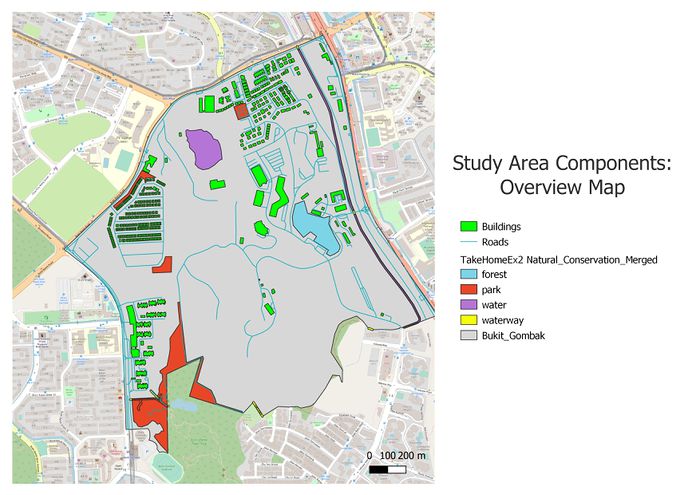
The following shows an overview of the study area and its map components we want to consider in this suitability land analysis for the Communicable Disease Quarantine Centre in Bukit Gombak:
FIGURE I
Study Area Map Components
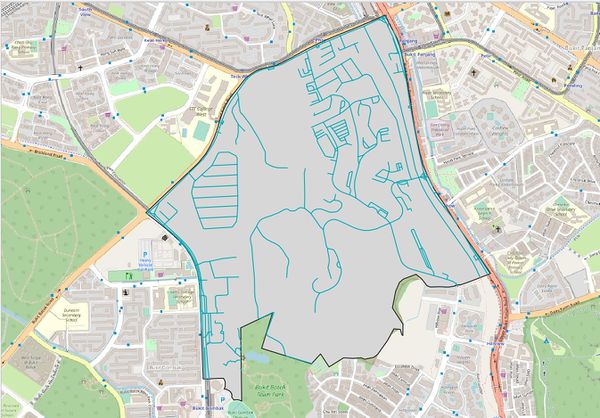
FIGURE II
Target Road Map
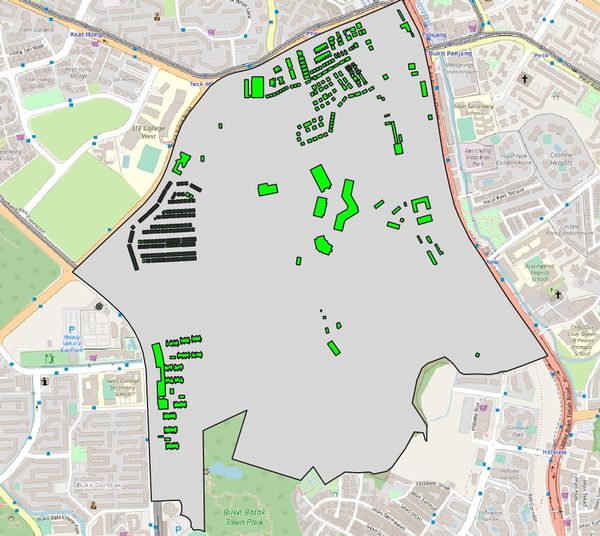
FIGURE III
Target Building Map
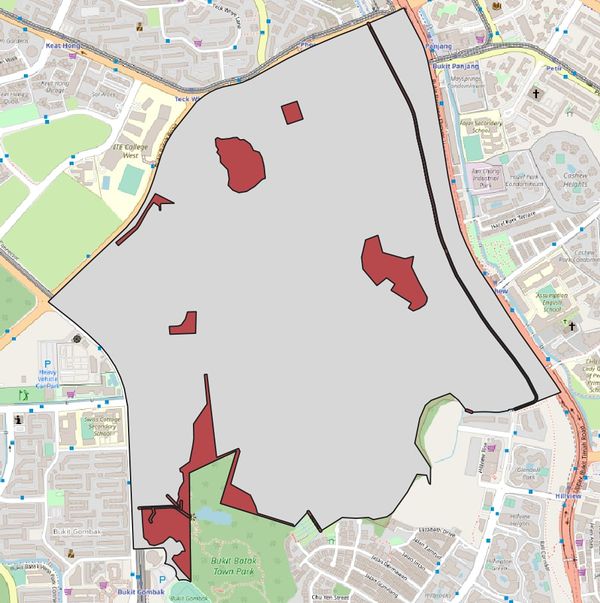
FIGURE III
Target Natural Features Map
FIGURE IV
Incomplete Waterway Target Inclusion. Applying buffering and merging of polygons in QGIS.
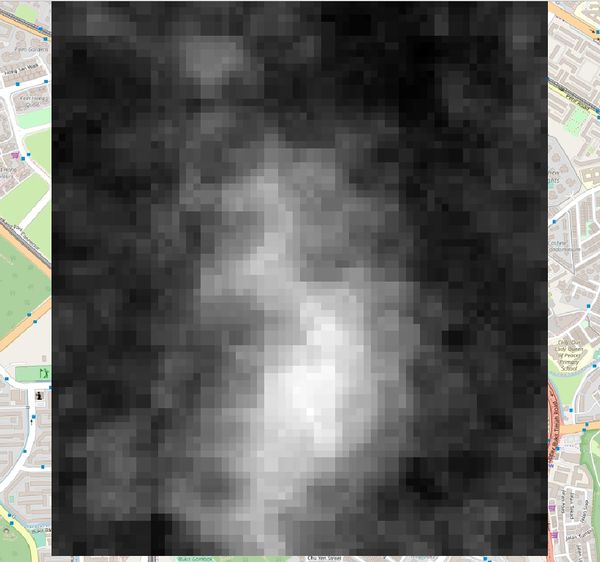
FIGURE V
Digital Elevation Map
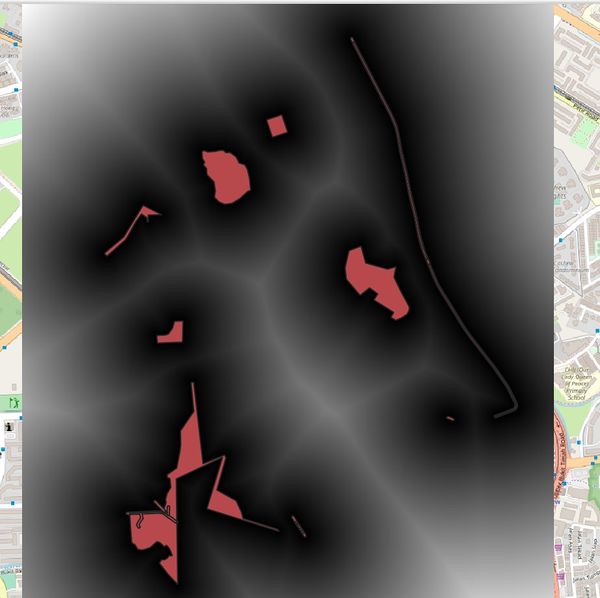
Part 2: Study Area Proximity Maps
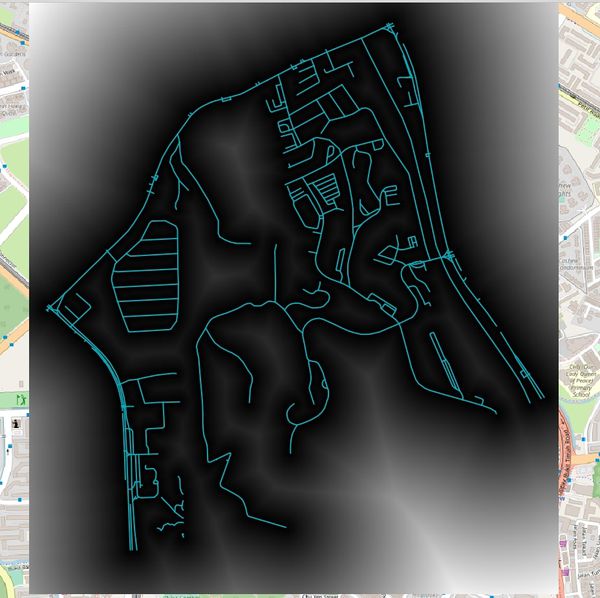
FIGURE VI
Accessibility Factor: Road Proximity Map
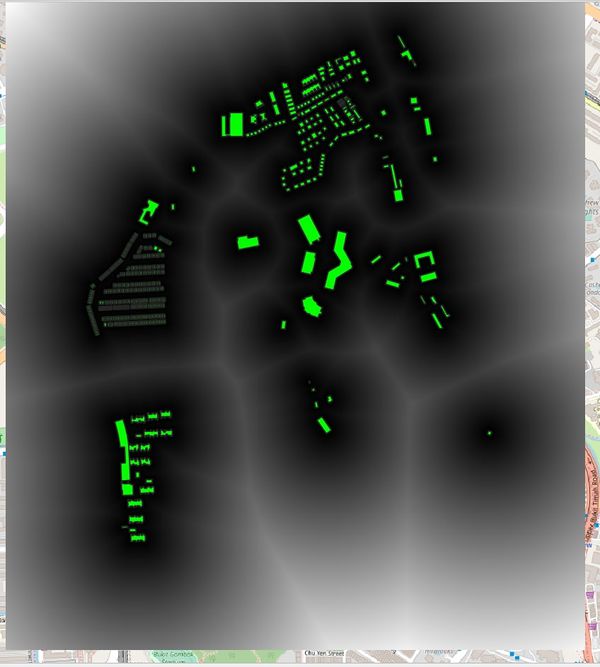
FIGURE VII
Health Risk Factor: Building Proximity Map
FIGURE VIII
Natural Conservation Factor:: Natural Features Proximity Map
FIGURE IX
Economic Factor: Slope Layer
Criterion Scores for Map Components
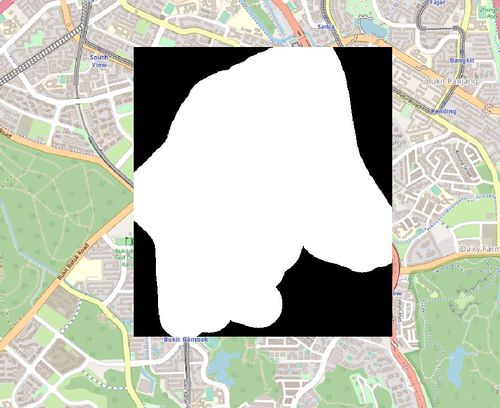
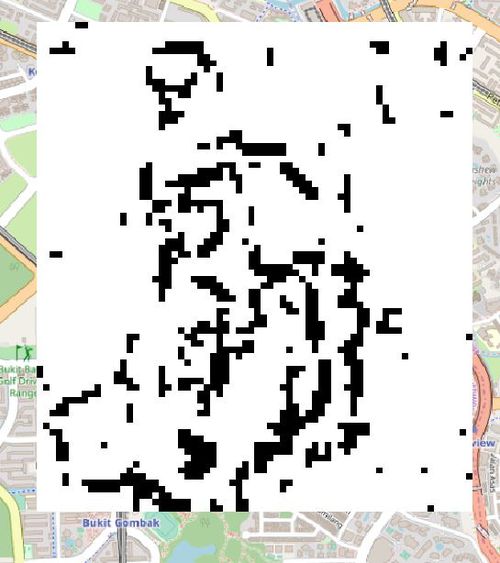
FIGURE X
Accesibility Factor: Road Binary & Criteria Score
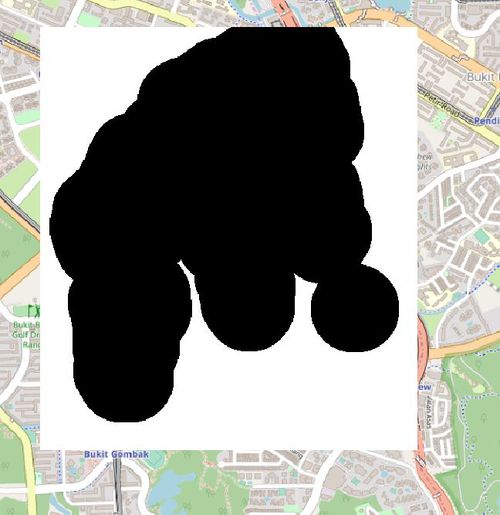
FIGURE XI
Health Risk Factor: Building Binary & Criteria Score
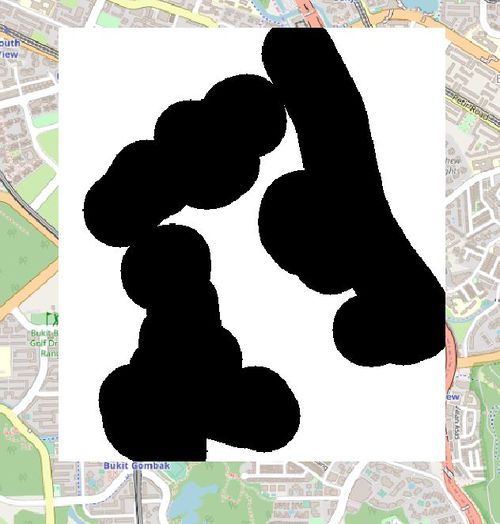
FIGURE XII
Natural Conservation Factor: Natural Features Binary & Criteria Score
FIGURE XIII
Economical Factor: Slope Binary & Criteria Score
Analytical Hierarchical Process Input Matrix & Approach
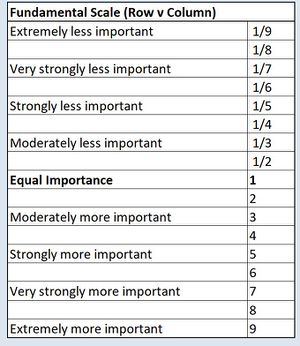
FIGURE XIV
SCB Associates' AHP Scoring Framework
FIGURE XV
AHP Scoring Framework for Accounting Factors
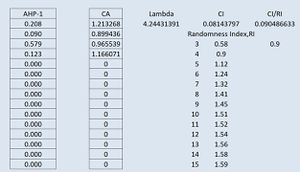
FIGURE XVI
AHP Results
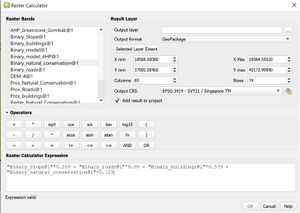
FIGURE XVII
Weighing AHP Scores into QGIS Raster Calculator
FIGURE XVIII
Reclassifying Raster Values using SAGA's Plugin for Degrees of Suitability
Recommendation
FIGURE XIX
Suitability Map Overview
FIGURE XX
Qualitative Analysis: Zooming into Possible Region Using Google's Satelitte
FIGURE XXI
Making Recommendation based on Availibity of Land
