Difference between revisions of "SMT201 AY2019-20G2 Ex1 JerryTohvan"
(Created page with "== Part 1: Thematic Mapping == {| class="wikitable" |- ! Data !! Visualisation & Processing Technique |- | General information of schools from the “School Directory and In...") |
|||
| Line 1: | Line 1: | ||
== Part 1: Thematic Mapping == | == Part 1: Thematic Mapping == | ||
| − | + | The thematic mapping developed uses these following data and applied techniques: <br> | |
{| class="wikitable" | {| class="wikitable" | ||
|- | |- | ||
| Line 9: | Line 9: | ||
Symbology: Categorised by `mainlevel_` attribute which indicates if an indicated point belongs to either centralised institute, junior college, mixed level, secondary or primary school. Each category is labeled with following color:<br> | Symbology: Categorised by `mainlevel_` attribute which indicates if an indicated point belongs to either centralised institute, junior college, mixed level, secondary or primary school. Each category is labeled with following color:<br> | ||
<br> | <br> | ||
| − | [[File:Fig1.png|300px]]<br> | + | [[File:Fig1.png|300px|center]]<br> |
| − | FIGURE I | + | <p class=MsoNormal align=center style='text-align:center;line-height:normal'><span |
| − | + | lang=EN-GB style='font-size:8.0pt;font-family:"Times New Roman",serif; | |
| + | mso-fareast-font-family:"Times New Roman";font-variant:small-caps;color:white'><span | ||
| + | style='color:windowtext'>FIGURE I</span></span></p> | ||
| + | <p class=MsoNormal align=center style='text-align:center;line-height:normal'><span | ||
| + | lang=EN-GB style='font-size:8.0pt;font-family:"Times New Roman",serif; | ||
| + | mso-fareast-font-family:"Times New Roman";font-variant:small-caps;color:white'><span | ||
| + | style='color:windowtext'>ROAD SELECTION LINE AND MAP LINE | ||
| + | </span></span></p> | ||
| + | |||
<br> | <br> | ||
Color choices were contrasted differently from other components/layers for easy reference. | Color choices were contrasted differently from other components/layers for easy reference. | ||
| Line 26: | Line 34: | ||
| − | [[File:Fig2.png|250px]]<br> | + | [[File:Fig2.png|250px|center]]<br> |
| − | FIGURE II< | + | <p class=MsoNormal align=center style='text-align:center;line-height:normal'><span |
| − | SCALE VISIBILITY | + | lang=EN-GB style='font-size:8.0pt;font-family:"Times New Roman",serif; |
| + | mso-fareast-font-family:"Times New Roman";font-variant:small-caps;color:white'><span | ||
| + | style='color:windowtext'>FIGURE II</span></span></p> | ||
| + | <p class=MsoNormal align=center style='text-align:center;line-height:normal'><span | ||
| + | lang=EN-GB style='font-size:8.0pt;font-family:"Times New Roman",serif; | ||
| + | mso-fareast-font-family:"Times New Roman";font-variant:small-caps;color:white'><span | ||
| + | style='color:windowtext'>SCALE VISIBILITY | ||
| + | </span></span></p> | ||
<br><br> | <br><br> | ||
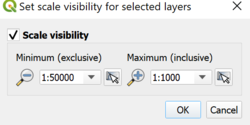
Visualisation Rule: The visibility of Land Use layer is automatically displayed as the user zooms in approximately 1-2 times. | Visualisation Rule: The visibility of Land Use layer is automatically displayed as the user zooms in approximately 1-2 times. | ||
| Line 37: | Line 52: | ||
Visualisation Rule: | Visualisation Rule: | ||
| − | [[File:Fig3.png|250px]] <br> | + | [[File:Fig3.png|250px|center]] <br> |
| − | FIGURE III< | + | <p class=MsoNormal align=center style='text-align:center;line-height:normal'><span |
| − | ROAD SELECTION LINE AND MAP LINE | + | lang=EN-GB style='font-size:8.0pt;font-family:"Times New Roman",serif; |
| − | < | + | mso-fareast-font-family:"Times New Roman";font-variant:small-caps;color:white'><span |
| + | style='color:windowtext'>FIGURE III</span></span></p> | ||
| + | <p class=MsoNormal align=center style='text-align:center;line-height:normal'><span | ||
| + | lang=EN-GB style='font-size:8.0pt;font-family:"Times New Roman",serif; | ||
| + | mso-fareast-font-family:"Times New Roman";font-variant:small-caps;color:white'><span | ||
| + | style='color:windowtext'>ROAD SELECTION LINE AND MAP LINE | ||
| + | </span></span></p> | ||
Processing: 2 datasets was used to represent different types of road. The national map line only provides expressway, major roads, international boundary and contour lines, the road selection data provides overall road network in Singapore. The Map Line layer highlights its road types using the categorisation rule, applying different colours and line width to emphasize type of road. The minor road can be implied by excluding road network that belongs to express way, intersections, and major roads. | Processing: 2 datasets was used to represent different types of road. The national map line only provides expressway, major roads, international boundary and contour lines, the road selection data provides overall road network in Singapore. The Map Line layer highlights its road types using the categorisation rule, applying different colours and line width to emphasize type of road. The minor road can be implied by excluding road network that belongs to express way, intersections, and major roads. | ||
| Line 53: | Line 74: | ||
|} | |} | ||
<br> | <br> | ||
| − | [[File: | + | [[File:Image.jpg|700px|center]] |
| + | <p class=MsoNormal align=center style='text-align:center;line-height:normal'><span | ||
| + | lang=EN-GB style='font-size:8.0pt;font-family:"Times New Roman",serif; | ||
| + | mso-fareast-font-family:"Times New Roman";font-variant:small-caps;color:white'><span | ||
| + | style='color:windowtext'>FIGURE IV</span></span></p> | ||
| + | <p class=MsoNormal align=center style='text-align:center;line-height:normal'><span | ||
| + | lang=EN-GB style='font-size:8.0pt;font-family:"Times New Roman",serif; | ||
| + | mso-fareast-font-family:"Times New Roman";font-variant:small-caps;color:white'><span | ||
| + | style='color:windowtext'>OVERVIEW OF THEMATIC MAPPING</span></span></p> | ||
| + | |||
| + | |||
| + | [[File:Img2.png|300px|center]] | ||
| + | <p class=MsoNormal align=center style='text-align:center;line-height:normal'><span | ||
| + | lang=EN-GB style='font-size:8.0pt;font-family:"Times New Roman",serif; | ||
| + | mso-fareast-font-family:"Times New Roman";font-variant:small-caps;color:white'><span | ||
| + | style='color:windowtext'>FIGURE IV</span></span></p> | ||
| + | <p class=MsoNormal align=center style='text-align:center;line-height:normal'><span | ||
| + | lang=EN-GB style='font-size:8.0pt;font-family:"Times New Roman",serif; | ||
| + | mso-fareast-font-family:"Times New Roman";font-variant:small-caps;color:white'><span | ||
| + | style='color:windowtext'>MICRO VIEW OF LAND USE VISIBILITY WITH ROAD NETWORKS AND SCHOOL DATA POINTS | ||
| + | </span></span></p> | ||
| + | |||
| + | |||
<br> | <br> | ||
| − | [[File:Img4.png|700px]] | + | |
| + | [[File:Img3.png|700px|center]] | ||
| + | <p class=MsoNormal align=center style='text-align:center;line-height:normal'><span | ||
| + | lang=EN-GB style='font-size:8.0pt;font-family:"Times New Roman",serif; | ||
| + | mso-fareast-font-family:"Times New Roman";font-variant:small-caps;color:white'><span | ||
| + | style='color:windowtext'>FIGURE VI</span></span></p> | ||
| + | <p class=MsoNormal align=center style='text-align:center;line-height:normal'><span | ||
| + | lang=EN-GB style='font-size:8.0pt;font-family:"Times New Roman",serif; | ||
| + | mso-fareast-font-family:"Times New Roman";font-variant:small-caps;color:white'><span | ||
| + | style='color:windowtext'>SUBZONE VIEW | ||
| + | </span></span></p> | ||
| + | |||
| + | [[File:Img4.png|700px|center]] | ||
| + | <p class=MsoNormal align=center style='text-align:center;line-height:normal'><span | ||
| + | lang=EN-GB style='font-size:8.0pt;font-family:"Times New Roman",serif; | ||
| + | mso-fareast-font-family:"Times New Roman";font-variant:small-caps;color:white'><span | ||
| + | style='color:windowtext'>FIGURE VII</span></span></p> | ||
| + | <p class=MsoNormal align=center style='text-align:center;line-height:normal'><span | ||
| + | lang=EN-GB style='font-size:8.0pt;font-family:"Times New Roman",serif; | ||
| + | mso-fareast-font-family:"Times New Roman";font-variant:small-caps;color:white'><span | ||
| + | style='color:windowtext'>OPENSTREETMAP VIEW | ||
| + | </span></span></p> | ||
| + | |||
<br> | <br> | ||
| − | |||
Revision as of 10:31, 14 September 2019
Part 1: Thematic Mapping
The thematic mapping developed uses these following data and applied techniques:
| Data | Visualisation & Processing Technique |
|---|---|
| General information of schools from the “School Directory and Information” dataset retrieved from data.gov.sg. | Layer: School
Symbology: Categorised by `mainlevel_` attribute which indicates if an indicated point belongs to either centralised institute, junior college, mixed level, secondary or primary school. Each category is labeled with following color: FIGURE I ROAD SELECTION LINE AND MAP LINE
Processing: The initial dataset was geocoded using the MMQIS by its `address` field in order to retrieve `latlong` projection of the data points. Data not found: |
| “Masterplan 2014 Landuse” dataset retrieved from data.gov.sg. | Layer: Land Use
Symbology: Light Grey simple fill
FIGURE II SCALE VISIBILITY
|
| SLA’s National Map Line retrieved from data.gov.sg. Road Selection Line dataset retrieved from SLA provided by Prof Kam (HandsOnEx1). |
Layer: Map Line & Road Network
FIGURE III ROAD SELECTION LINE AND MAP LINE Processing: 2 datasets was used to represent different types of road. The national map line only provides expressway, major roads, international boundary and contour lines, the road selection data provides overall road network in Singapore. The Map Line layer highlights its road types using the categorisation rule, applying different colours and line width to emphasize type of road. The minor road can be implied by excluding road network that belongs to express way, intersections, and major roads. |
| “MP14_SUBZONE_NO_SEA_PL” by URA retrieved from data.gov.sg. | Layer: MP14_SUBZONE_NO_SEA_PL
Symbology: Light Brown simple fill Was included to provide a macro view base layer as an optional display. The layer represents subzones that could be useful in interpreting where road networks or school is located. OpenStreetMap view could also be used, however the subzone layer better express the subzone boundaries through a simple display. |
FIGURE IV
OVERVIEW OF THEMATIC MAPPING
FIGURE IV
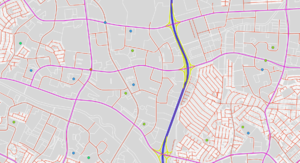
MICRO VIEW OF LAND USE VISIBILITY WITH ROAD NETWORKS AND SCHOOL DATA POINTS
FIGURE VI
SUBZONE VIEW
FIGURE VII
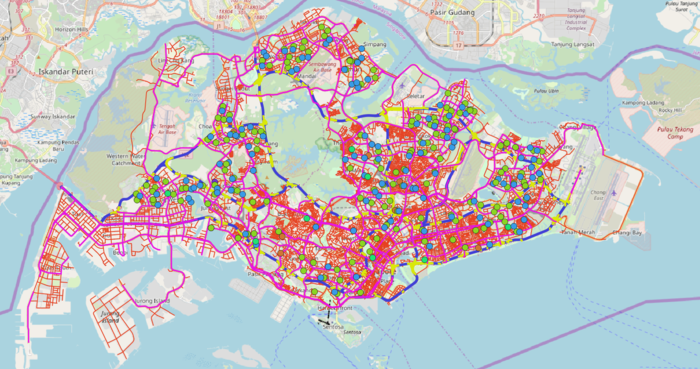
OPENSTREETMAP VIEW


