Difference between revisions of "G2-Group10 Proposal"
| Line 234: | Line 234: | ||
<!--/PROJECT SCHEDULE--> | <!--/PROJECT SCHEDULE--> | ||
|} | |} | ||
| − | [[File:Annotation 2019-10-19 210740.png | + | [[File:Annotation 2019-10-19 210740.png|frameless|center]] |
<!--PROJECT SCHEDULE TEXT--> | <!--PROJECT SCHEDULE TEXT--> | ||
TEST | TEST | ||
Revision as of 14:05, 21 October 2019
| HOME | PROJECT REPORT |
|
PROJECT MOTIVATION |
TEST
|
PROJECT OBJECTIVE |
To cover trade area analysis in detail through:
- Delineation of Trade Area of each stores
- Analyze overlapping trade areas of each stores
- Analyze buffering zone of each stores
- Create profiles of customers using 5 cluster for each trade area (To target the largest customer)
- Analyze POIs of each trade area of each store to see if it affects sales (e.g. Proximity of stores)
|
DATA |
TEST
|
SCOPE OF WORK |
TEST
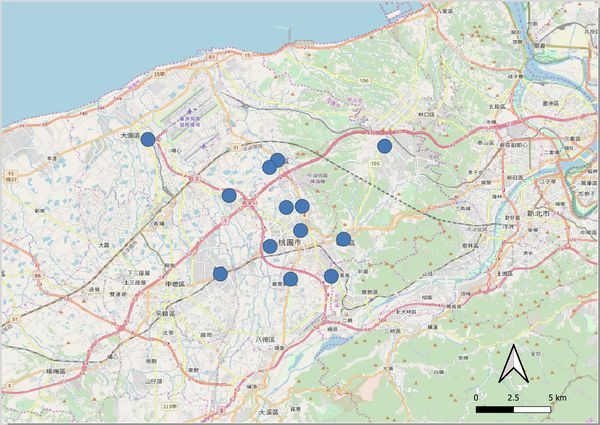
As the client has many outlets located all over Taiwan, each group is allocated 13-15 stores to work on for the trade area analysis. Our group was allocated the outlets within Taoyuan City (桃园市), as shown in the map above. The stores include,
| Store Code | Store Name | Total Trade Area 總區塊 !! No. of Household | |
|---|---|---|---|
| DU | 桃園大園店 | 13 | 16414 |
| LK | 林口長庚店 | 13 | 15331 |
| KW | 桃園龜山店 | 20 | 37643 |
| CZ | 桃園春日店 | Example | Example |
| Example | Example | Example | Example |
| Example | Example | Example | Example |
| Example | Example | Example | Example |
| Example | Example | Example | Example |
| Example | Example | Example | Example |
| Example | Example | Example | Example |
| Example | Example | Example | Example |
| Example | Example | Example | Example |
| Example | Example | Example | Example |
| Example | Example | Example | Example |
17
20963
NQ
桃園南崁店
10
28004
RJ
桃園南昌店
7
14084
WL
桃園武陵店
15
37925
TD (TK)
桃園同德店
13
29665
NL
內壢中華店
19
34925
TE
桃園桃鶯店
21
32697
PD
桃園八德店
15
32216
TY
Missing location map
DZ
Missing location map
Other than the stores, we are also provided with information of points of interests (POIs). These points of interests will help us strengthen our trade area analysis based on the concentration of facilities in the area.
Facility Description Facility Type 1. ATM 3578 2. BANK 6000 3. BAR OR PUB 9532 4. BOOKSTORE 9995 5. BOWLING CENTRE 7933 6. BUS STATION 4170 7. BUSINESS FACILITY 5000 8. CINEMA 7832 9. CLOTHING STORE 9537 10. COFFEE SHOP 9996 11. COMMUTER RAIL STATION 4100 12. CONSUMER ELECTRONICS STORE 9987 13. CONVENIENCE STORE 9535 14. DEPARTMENT STORE 9545 15. GOVERNMENT OFFICE 9525 16. GROCERY STORE 5400 17. HIGHER EDUCATION 8200 18. HOSPITAL 8060 19. HOTEL 7011 20. MEDICAL SERVICE 9583 21. PHARMACY 9565 22. RESIDENTIAL AREA/BUILDING 9590 23, RESTAURANT 5800 24. SCHOOL 8211 25. SHOPPING 6512 26. SPORTS CENTRE 7997 27. SPORTS COMPLEX 7940 28. TRAIN STATION 4013
|
PROJECT SCHEDULE |
TEST

