Difference between revisions of "SMT201 AY2019-20T1 EX1 Lek Jan Yee Lois"
| (38 intermediate revisions by the same user not shown) | |||
| Line 1: | Line 1: | ||
==Part One: Thematic Mapping== | ==Part One: Thematic Mapping== | ||
| − | |||
| − | [[File:Education Institutions.jpg|frameless|Distribution of Public Education Institutions by School Type|500px|left]] | + | [[File:Education Institutions.jpg|frameless|Distribution of Public Education Institutions by School Type|500px|left]] |
| + | <big>'''Distribution of Public Education Institutions by School Type'''</big> <br> | ||
| + | <p> The data used for the Education Institutions layer is the School Directory and Information data from Data.gov. The data is geocoded using MMQGIS and categorised according to school type. The school types are differentiated by colour. The squares provide an overview of the distribution of schools and is placed on the Open Street Map layer for easy identification of the location.</p> | ||
<br> | <br> | ||
| + | [[File:Road System Singapore.jpg|500px|frameless|right]] <br> | ||
| Line 15: | Line 17: | ||
| − | + | <big>'''Road System Singapore'''</big><br> | |
| − | |||
| − | |||
| − | |||
| − | |||
| − | |||
| − | |||
| − | |||
| − | |||
| − | |||
| − | |||
| − | |||
| − | |||
| − | |||
| − | |||
| − | |||
| − | |||
| − | |||
| − | |||
| − | |||
| − | |||
| − | |||
| − | |||
| − | |||
| − | |||
| − | |||
| − | |||
| − | <big>'''Road System Singapore'''</big> | ||
| − | |||
<p> The data used for the Road System Singapore layer is taken from the National Line Map data from Data.gov. The data is categorised using the folderpath column, by road type (Expressway, Expressway Sliproad, Major Roads) and the Open Street Map layer was added to give a better understanding of the geographical location of the roads. The major roads and expressways are well connected allowing drivers to be able to get from one location to another efficiently. </p> | <p> The data used for the Road System Singapore layer is taken from the National Line Map data from Data.gov. The data is categorised using the folderpath column, by road type (Expressway, Expressway Sliproad, Major Roads) and the Open Street Map layer was added to give a better understanding of the geographical location of the roads. The major roads and expressways are well connected allowing drivers to be able to get from one location to another efficiently. </p> | ||
| Line 50: | Line 24: | ||
| + | [[File:Landuse Plan 2014.jpg|500px|frameless|left]] | ||
| + | <big>'''Landuse Plan 2014'''</big><br> | ||
| − | |||
| − | |||
| − | |||
| − | |||
| − | |||
| − | |||
| − | |||
| − | |||
| − | |||
| − | |||
| − | |||
| − | |||
| − | |||
| − | |||
<p>The Landuse Plan is divided into several categories using the LU_DESC column in Master Plan 2014 Landuse shpfile from Data.gov. The label 'white' zone signifies mixed development use.</p><br> | <p>The Landuse Plan is divided into several categories using the LU_DESC column in Master Plan 2014 Landuse shpfile from Data.gov. The label 'white' zone signifies mixed development use.</p><br> | ||
| − | |||
| − | |||
| − | |||
| − | |||
| − | |||
| − | |||
| − | |||
| − | |||
| − | |||
| − | |||
| − | |||
| − | |||
| Line 98: | Line 48: | ||
==Part II: Choropleth Mapping== | ==Part II: Choropleth Mapping== | ||
| − | <big>'''Aged Population | + | <big>'''Aged Population by Subzone'''</big> |
| − | + | [[File:Aged Population 2010.jpg|500px|frameless|left]] | |
| − | [[File:Aged Population 2010.jpg|500px|frameless|left]] | + | [[File:Aged Population 2018.jpg|500px|frameless|right]] |
| Line 123: | Line 73: | ||
| − | |||
| − | |||
| + | <big>'''Aged Population 2010'''</big> | ||
| + | <p> The Aged Population layer was taken from the excel file Singapore Residents by Planning Area/Subzone and Type of Dwelling, June 2000 - 2018, Singstat. I prepared the file by changing the values which were "-" to 0 and changed the values to general as the original ended up as a string when exported to csv. The columns were renamed in caps to make the conversion to csv smoother. I deleted the two tables which were grouped by male and female. The xls file was exported to csv and placed as a delimited text layer. I joined the delimited text layer with the Planning Subzone layer by SUBZONE_N. I summed up the columns 65-69, 70-74, 75-79, 80-84, 85 and above to get the column "Age65+", which is the Aged Population. </p><br> | ||
| + | <big>'''Aged Population 2018'''</big> | ||
| + | <p> The Aged Population 2018 layer was done similarly. I used the same colour representation for the same range of numbers for the viewer to easy visualise the change in the Aged Population by Subzone. </p> | ||
| + | <big>'''Proportion of Aged Population by Subzone'''</big><br> | ||
| + | [[File:Proportion of Aged Population by Subzone 2010.jpg|500px|frameless|left]] | ||
| + | [[File:Proportion_of_Aged_Population_2018_.jpg|500px|frameless|right]] | ||
| + | <p>The Aged Population Proportion layer was created by using the formula ((Aged Population in Subzone / Total Population in Subzone)*100). The column type name is placed as Real to account for decimals. I used the Symbology > Graduated and sorted the numbers by natural breaks. The Open Street Map was used for easy referencing for the viewers of the exact location of change. I standardised the colours and value ranges for a better comparison between 2010 and 2018.</p> | ||
| + | <big>'''Percentage Change in Aged Population from 2010 to 2018'''</big> | ||
| + | [[File:Percentage Change In Aged Population 2010-2018.jpg|500px|frameless|left]]<br> | ||
| + | <p> The layer was created by using the formula ((Aged Population 2018 - Aged Population 2010)/Aged Population 2010))*100 to get the percentage change in Aged Population from 2010 to 2018. The negative percentages show that there was a decrease in the number of aged population in that particular subzone.</p> | ||
| Line 153: | Line 112: | ||
| − | |||
| − | |||
| − | |||
| − | |||
| − | |||
| − | |||
| − | |||
| − | |||
| − | |||
| − | |||
| − | |||
| − | |||
| − | |||
| − | |||
| − | |||
| − | |||
| − | |||
| − | |||
| − | |||
| − | |||
| − | |||
| − | |||
| − | |||
| − | |||
| − | |||
| − | |||
| − | |||
| − | |||
| − | |||
| − | |||
| − | |||
| − | |||
| − | |||
| − | |||
| − | |||
| − | |||
| − | |||
| − | |||
| − | |||
| − | |||
| − | |||
| − | |||
| − | |||
| − | |||
| − | |||
| − | |||
| − | |||
| − | |||
| − | |||
| − | |||
| − | |||
| − | |||
| − | |||
| − | |||
| − | |||
| − | |||
| − | |||
| − | |||
| − | |||
| − | |||
| − | |||
| − | |||
==References== | ==References== | ||
#Singstat Population Geographic Distribution [[https://www.singstat.gov.sg/find-data/search-by-theme/population/geographic-distribution/latest-data]] | #Singstat Population Geographic Distribution [[https://www.singstat.gov.sg/find-data/search-by-theme/population/geographic-distribution/latest-data]] | ||
| + | #MasterPlan2014Landuse [[https://data.gov.sg/dataset/master-plan-2014-land-use]] | ||
| + | #NationalMapLine [[https://data.gov.sg/dataset/national-map-line]] | ||
| + | #School Directory and Information [[https://data.gov.sg/dataset/school-directory-and-information]] | ||
| + | #Subzone Boundary [[https://data.gov.sg/dataset/master-plan-2014-subzone-boundary-no-sea?resource_id=c30bfcc0-7e23-4959-b4d9-c5da5e00af54]] | ||
Latest revision as of 23:49, 15 September 2019
Part One: Thematic Mapping
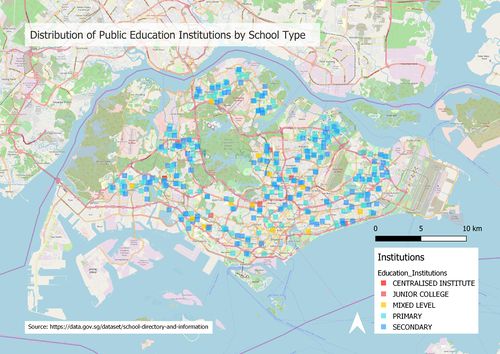
Distribution of Public Education Institutions by School Type
The data used for the Education Institutions layer is the School Directory and Information data from Data.gov. The data is geocoded using MMQGIS and categorised according to school type. The school types are differentiated by colour. The squares provide an overview of the distribution of schools and is placed on the Open Street Map layer for easy identification of the location.
Road System Singapore
The data used for the Road System Singapore layer is taken from the National Line Map data from Data.gov. The data is categorised using the folderpath column, by road type (Expressway, Expressway Sliproad, Major Roads) and the Open Street Map layer was added to give a better understanding of the geographical location of the roads. The major roads and expressways are well connected allowing drivers to be able to get from one location to another efficiently.
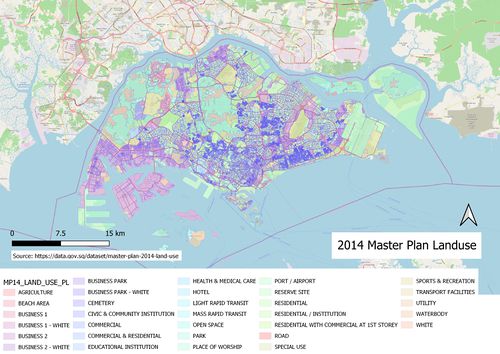
Landuse Plan 2014
The Landuse Plan is divided into several categories using the LU_DESC column in Master Plan 2014 Landuse shpfile from Data.gov. The label 'white' zone signifies mixed development use.
Part II: Choropleth Mapping
Aged Population by Subzone
Aged Population 2010
The Aged Population layer was taken from the excel file Singapore Residents by Planning Area/Subzone and Type of Dwelling, June 2000 - 2018, Singstat. I prepared the file by changing the values which were "-" to 0 and changed the values to general as the original ended up as a string when exported to csv. The columns were renamed in caps to make the conversion to csv smoother. I deleted the two tables which were grouped by male and female. The xls file was exported to csv and placed as a delimited text layer. I joined the delimited text layer with the Planning Subzone layer by SUBZONE_N. I summed up the columns 65-69, 70-74, 75-79, 80-84, 85 and above to get the column "Age65+", which is the Aged Population.
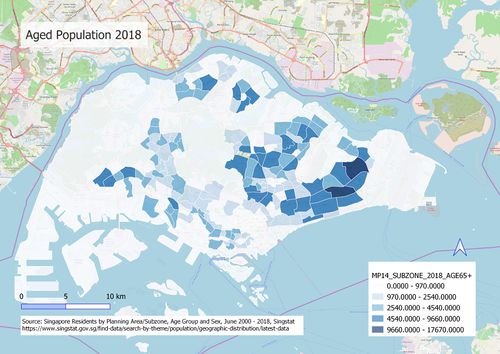
Aged Population 2018
The Aged Population 2018 layer was done similarly. I used the same colour representation for the same range of numbers for the viewer to easy visualise the change in the Aged Population by Subzone.
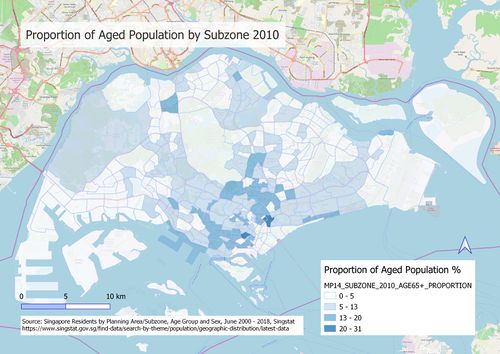
Proportion of Aged Population by Subzone
The Aged Population Proportion layer was created by using the formula ((Aged Population in Subzone / Total Population in Subzone)*100). The column type name is placed as Real to account for decimals. I used the Symbology > Graduated and sorted the numbers by natural breaks. The Open Street Map was used for easy referencing for the viewers of the exact location of change. I standardised the colours and value ranges for a better comparison between 2010 and 2018.
Percentage Change in Aged Population from 2010 to 2018
The layer was created by using the formula ((Aged Population 2018 - Aged Population 2010)/Aged Population 2010))*100 to get the percentage change in Aged Population from 2010 to 2018. The negative percentages show that there was a decrease in the number of aged population in that particular subzone.


