Difference between revisions of "SMT201 AY2019-20G1 Ex1 LeeHuiYun"
| Line 5: | Line 5: | ||
[[File:Public education institution LeeHuiYun.png|700px|center]] | [[File:Public education institution LeeHuiYun.png|700px|center]] | ||
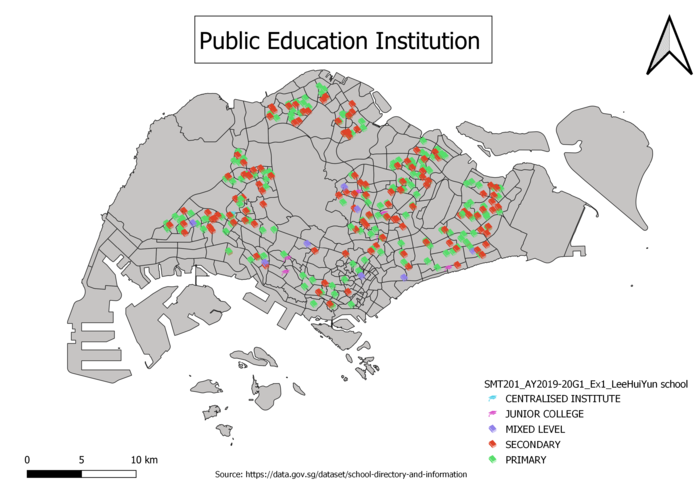
| − | + | In this thematic map it shows the distribution of public education institution in Singapore. The public education institution categories into 5 different category which show in the legend such as Primary, Secondary, Mixed Level, Junior college and Centralized Institution. My choice of classification for this image is categorized by mainlevel in the data. In addition, for visual, I used SVG marker to differentiate the different types of public education institution. | |
1.2 Hierarchy of road network system of Singapore | 1.2 Hierarchy of road network system of Singapore | ||
Revision as of 22:43, 15 September 2019
Part 1: Thematic Mapping
1.1 Distribution of public education institution
In this thematic map it shows the distribution of public education institution in Singapore. The public education institution categories into 5 different category which show in the legend such as Primary, Secondary, Mixed Level, Junior college and Centralized Institution. My choice of classification for this image is categorized by mainlevel in the data. In addition, for visual, I used SVG marker to differentiate the different types of public education institution.
1.2 Hierarchy of road network system of Singapore
1.3 2014 Master Plan Landuse
Part 2: Choropleth Mapping
2.1 Aged population (+65) in 2010 and 2018
2.1.1 Aged population (+65) in 2010
2.1.2 Aged population (+65) in 2018
2.2 Proportional of aged population in 2010 and 2018
2.3 Percentage change of aged population between 2010 and 2018


