Difference between revisions of "SMT201 AY2019-20T1 EX1 Tang Wan Yee"
| Line 3: | Line 3: | ||
=== Thematic Map 1 : School Information === | === Thematic Map 1 : School Information === | ||
| − | [[File: | + | [[File:Thematicmap 1.png|600px|center]] |
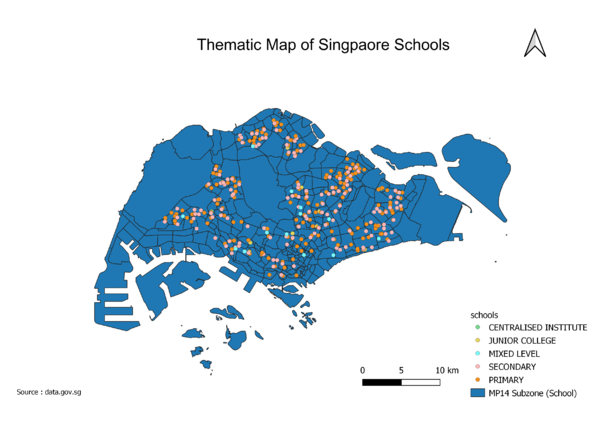
I used a point symbol as a qualitative symbol to map out the location and types of school. In comparison to a pictorial symbol, I find that having a point symbol with different colours would be easier to identify and more pleasing to the eyes as pictorial symbol on schools may be very similar to one another, defeating the purpose of differentiating. For colours, I went with a brighter palette for the point symbols in contrast with the darker colour of the background of the map. This is done so that the points will be able to stand out more to the viewer. | I used a point symbol as a qualitative symbol to map out the location and types of school. In comparison to a pictorial symbol, I find that having a point symbol with different colours would be easier to identify and more pleasing to the eyes as pictorial symbol on schools may be very similar to one another, defeating the purpose of differentiating. For colours, I went with a brighter palette for the point symbols in contrast with the darker colour of the background of the map. This is done so that the points will be able to stand out more to the viewer. | ||
| + | |||
| + | === Thematic Map 2 : Road Network System === | ||
| + | |||
| + | Line symbols are used to represent lin | ||
| + | [[File:Road network system .png|600px|center]] | ||
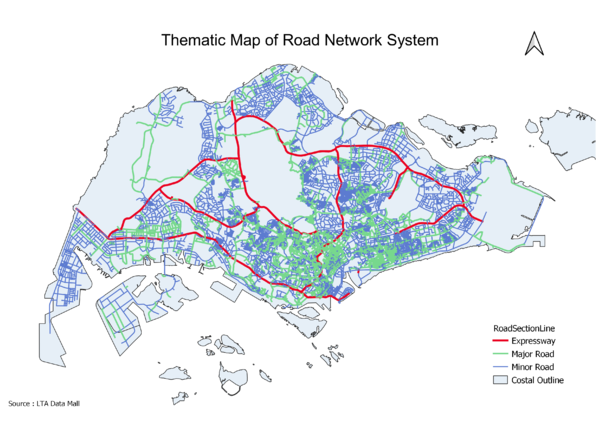
| + | ear features such as roads. In the above map, there are mainly 3 different type of roads. Road names with expressway was categorised into “Expressway” while road names with road was categorised into “Major Road”, leaving the remaining data to be categorised into “Minor Road”. The roads are being differentiated by the colour and thickness of the lines. I have chosen to use a thicker line to represent roads that are seen as “Larger”. | ||
Revision as of 21:22, 15 September 2019
Part 1: Thematic Mapping
Thematic Map 1 : School Information
I used a point symbol as a qualitative symbol to map out the location and types of school. In comparison to a pictorial symbol, I find that having a point symbol with different colours would be easier to identify and more pleasing to the eyes as pictorial symbol on schools may be very similar to one another, defeating the purpose of differentiating. For colours, I went with a brighter palette for the point symbols in contrast with the darker colour of the background of the map. This is done so that the points will be able to stand out more to the viewer.
Thematic Map 2 : Road Network System
Line symbols are used to represent lin
ear features such as roads. In the above map, there are mainly 3 different type of roads. Road names with expressway was categorised into “Expressway” while road names with road was categorised into “Major Road”, leaving the remaining data to be categorised into “Minor Road”. The roads are being differentiated by the colour and thickness of the lines. I have chosen to use a thicker line to represent roads that are seen as “Larger”.

