Difference between revisions of "SMT201 AY2019-20T1 EX1 Kning Kit Siang"
Jump to navigation
Jump to search


Kskning.2018 (talk | contribs) |
Kskning.2018 (talk | contribs) |
||
| Line 15: | Line 15: | ||
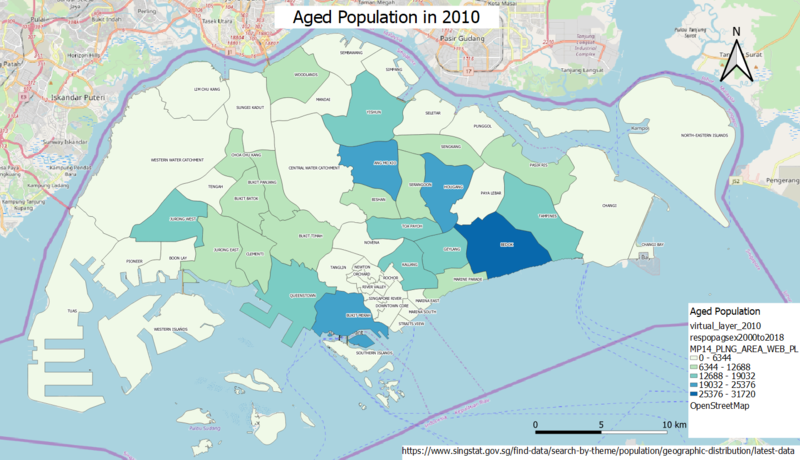
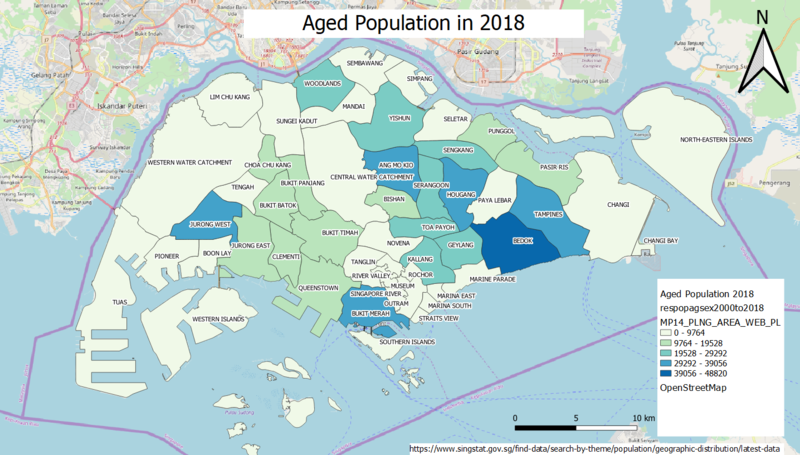
* '''Aged population (+65) in 2010 and 2018.''' | * '''Aged population (+65) in 2010 and 2018.''' | ||
[[File:Aged Population of Singapore in 2010.png|center|800px]] | [[File:Aged Population of Singapore in 2010.png|center|800px]] | ||
| + | |||
[[File:Aged Population of Singapore in 2018.png|center|800px]] | [[File:Aged Population of Singapore in 2018.png|center|800px]] | ||
| Line 20: | Line 21: | ||
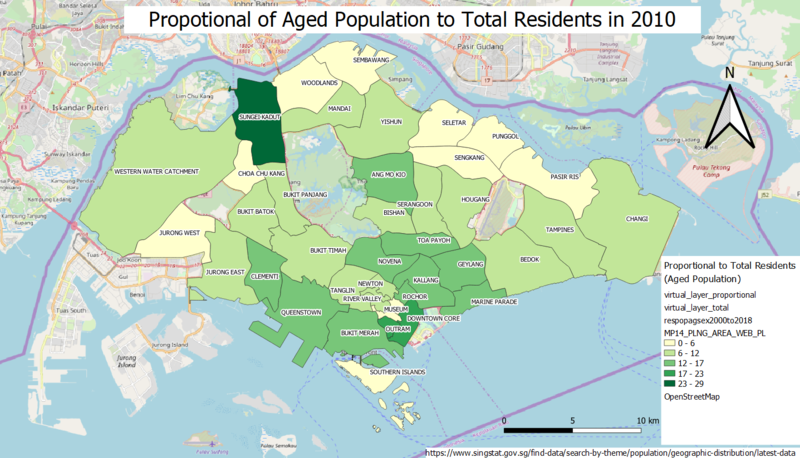
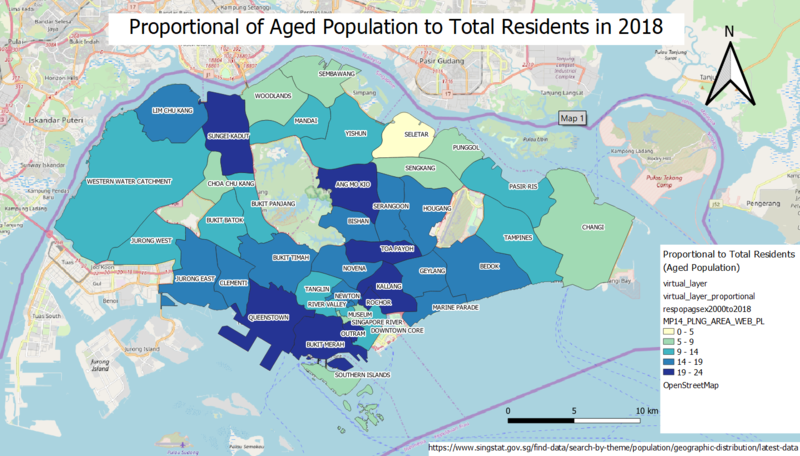
*'''Proportional of aged population in 2010 and 2018.''' | *'''Proportional of aged population in 2010 and 2018.''' | ||
[[File:Proportional of Aged Population to Total Residents in 2010.png|center|800px]] | [[File:Proportional of Aged Population to Total Residents in 2010.png|center|800px]] | ||
| + | |||
[[File:Proportional of Aged Population to Total Residents in 2018.png|center|800px]] | [[File:Proportional of Aged Population to Total Residents in 2018.png|center|800px]] | ||
Revision as of 19:06, 15 September 2019
Part 1: Thematic Mapping
- Using school information from data.gov.sg, prepare a thematic map showing the distribution of public education institution by school types such as primary, secondary, etc.

- Using road GIS data of LTA, prepare a thematic map showing the hierarchy of road network system of Singapore such as expressway, major road, minor road, etc.

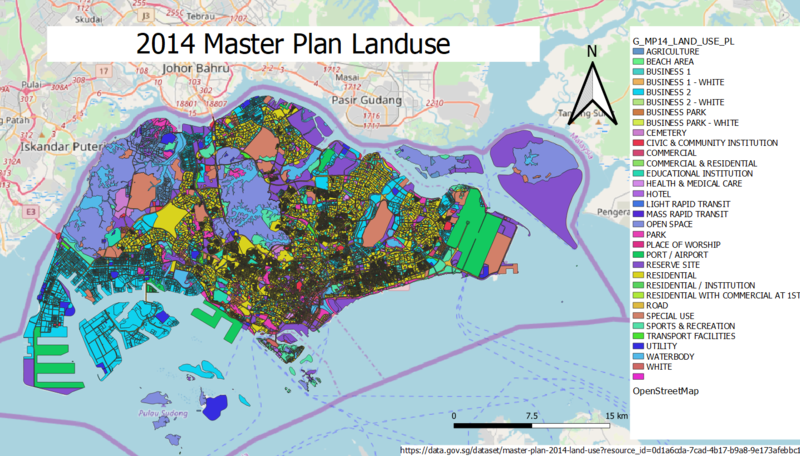
- Using master plan landuse GIS data from data.gov.sg, prepare a thematic map showing 2014 Master Plan Landuse.

Part 2: Choropleth Mapping
- Using planning subzone GIS data from data.gov.sg and Singapore residents by age group and gender, prepare the following choropleth maps:
- Aged population (+65) in 2010 and 2018.


- Proportional of aged population in 2010 and 2018.


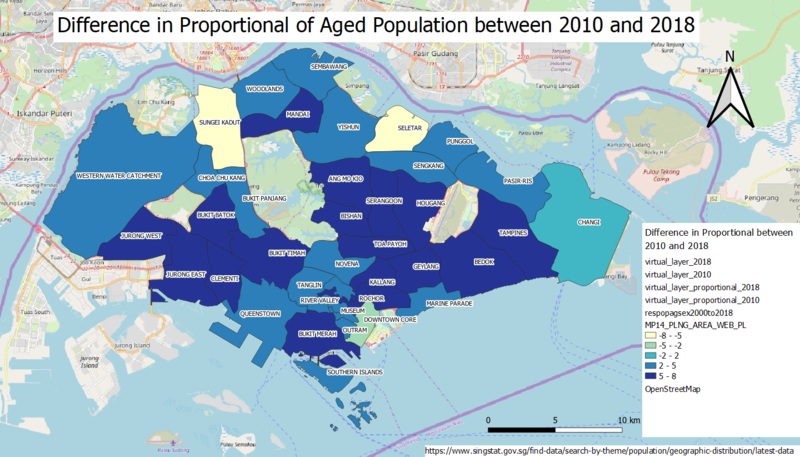
- Percentage change of aged population between 2010 and 2018.
