Difference between revisions of "SMT201 AY2019-20G2 EX1 Ho Jing Yi"
| Line 15: | Line 15: | ||
=== Thematic Map showing 2014 Master Plan Landuse in Singapore === | === Thematic Map showing 2014 Master Plan Landuse in Singapore === | ||
| − | + | ||
I created a new field where I categorized the field "LU_DESC" into 9 different categories such as business and commercial so as to create a better visualization of the different land use in Singapore for the user. Apart from that, I make sure that all 9 different categories are colored with contrasting colour so that user will be able to easily tell the different between them on the map. Also, since land use such as cemetery and worship place did not take up a huge area just by its own, I decided to categorized this type of land use into "Others" so that the map will not be overwhelm by too many categories. | I created a new field where I categorized the field "LU_DESC" into 9 different categories such as business and commercial so as to create a better visualization of the different land use in Singapore for the user. Apart from that, I make sure that all 9 different categories are colored with contrasting colour so that user will be able to easily tell the different between them on the map. Also, since land use such as cemetery and worship place did not take up a huge area just by its own, I decided to categorized this type of land use into "Others" so that the map will not be overwhelm by too many categories. | ||
| Line 21: | Line 21: | ||
== Part 2: Chloropleth Mapping == | == Part 2: Chloropleth Mapping == | ||
=== Chloropleth Map showing Aged Population in 2010 and 2018 === | === Chloropleth Map showing Aged Population in 2010 and 2018 === | ||
| − | [[File: | + | [[File:2010age65.jpg|550px]] |
| + | [[File:2018Age65.jpg|550px]] | ||
| + | |||
| + | I relational joined two different layers: 'Subzone' and 'Residents by Age Group and Sub Zone' by comparing fields in this two layers and identifying the field that contains the same attributes. From there, I created a new field by summing up the residents that is above 65 years old (aged population) and then creates a gradient symbology using that field to show the different intensity of aged population in different parts of Singapore. | ||
| + | |||
| + | In the map of 2010 and 2018, it show that the aged population is concentrated on the east west side of Singapore, based on the darker orange shown on the 2010 map and the darker purple shown on the 2018 map. | ||
| + | |||
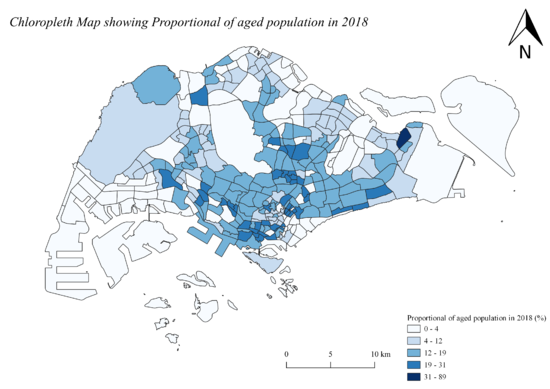
| + | === Chloropleth Map showing Proportional of Aged Population in 2010 and 2018 === | ||
| + | [[File:Proportional2010.png|550px]] | ||
| + | [[File:Proportional2018.png|550px]] | ||
Revision as of 18:45, 15 September 2019
Part 1: Thematic Mapping
Thematic Map showing the Distribution of Public Institutions in Singapore
Source: School Directory and Information [1] Coastal Outline: From Prof KAM Tin Seong's HandsOn Ex.4
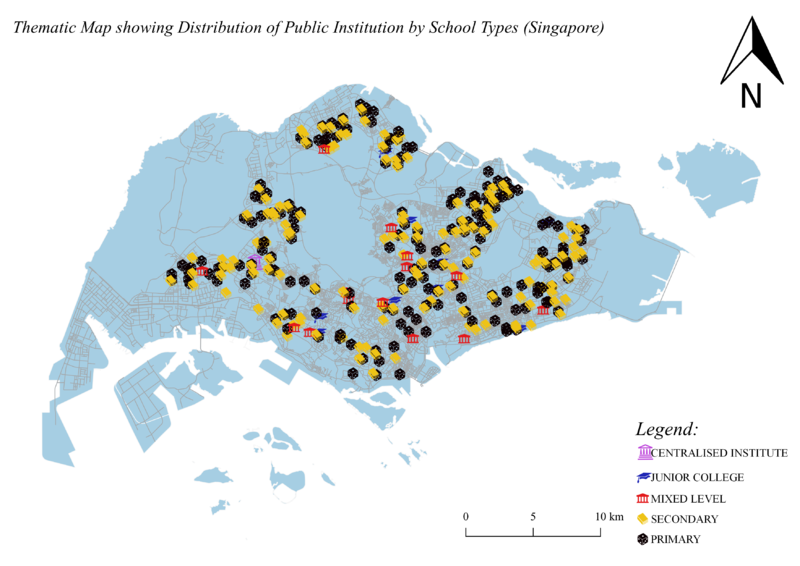
To show the distribution of public institutions by school types in Singapore, I used various SVG markers to represent different school types. Since primary school accounted for the largest percentage of public institutions in Singapore, I decided to change the colour to black so it will not overshadow the rest of the institutions. For the rest of the institutions, I decided to use a mix of different vibrant colours so that it will appear more noticeable against the light blue coastal outline.
Thematic Map showing the Hierarchy of Road Network System of Singapore
Source: Road Section Line [2] Coastal Outline: From Prof KAM Tin Seong's HandsOn Ex.4
I categorized the road in Singapore into 4 types based on their road name with reference to Remembering Singapore's street suffixes. I categorized road name that contains "Expressway", "Parkway", "Highway" into Expressway, road name that contains "Boulevard", "Avenue", "Way" into Major Road, road name that contains "Drive", "Street", "Road" into Minor Road and the rest into Local Access. The thickness of the line in the map is determined by how long and large the road is, in this case, expressway would be the thickest, followed by major, minor and then local access. A black coastal outline will also enable users to clearly see the strongly contrasted road system colours.
Thematic Map showing 2014 Master Plan Landuse in Singapore
I created a new field where I categorized the field "LU_DESC" into 9 different categories such as business and commercial so as to create a better visualization of the different land use in Singapore for the user. Apart from that, I make sure that all 9 different categories are colored with contrasting colour so that user will be able to easily tell the different between them on the map. Also, since land use such as cemetery and worship place did not take up a huge area just by its own, I decided to categorized this type of land use into "Others" so that the map will not be overwhelm by too many categories.
Part 2: Chloropleth Mapping
Chloropleth Map showing Aged Population in 2010 and 2018
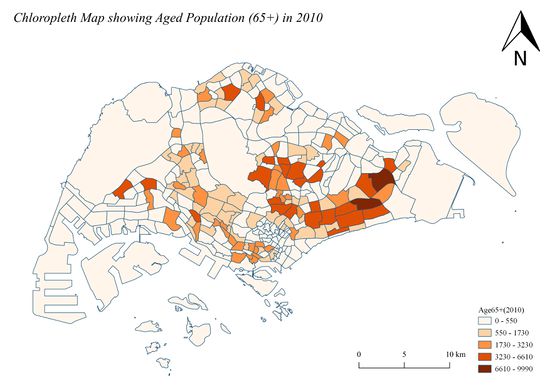
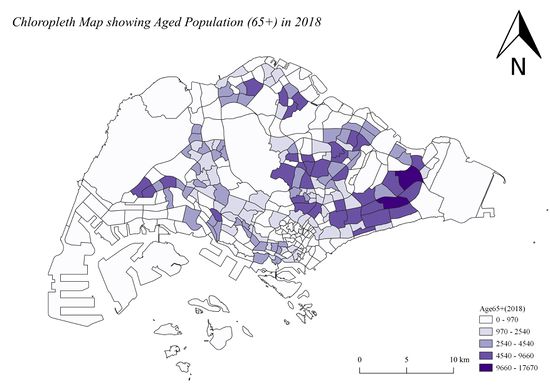
I relational joined two different layers: 'Subzone' and 'Residents by Age Group and Sub Zone' by comparing fields in this two layers and identifying the field that contains the same attributes. From there, I created a new field by summing up the residents that is above 65 years old (aged population) and then creates a gradient symbology using that field to show the different intensity of aged population in different parts of Singapore.
In the map of 2010 and 2018, it show that the aged population is concentrated on the east west side of Singapore, based on the darker orange shown on the 2010 map and the darker purple shown on the 2018 map.
