Difference between revisions of "SMT201 AY2019-20G1 Ex1 Lim Shen Jie"
Jump to navigation
Jump to search
| Line 2: | Line 2: | ||
[[File:Map1 schools zoomed out.png|400px|thumb|left|Schools]][[File:Map1 school.png|400px|thumb|left|Schools zoomed in]] | [[File:Map1 schools zoomed out.png|400px|thumb|left|Schools]][[File:Map1 school.png|400px|thumb|left|Schools zoomed in]] | ||
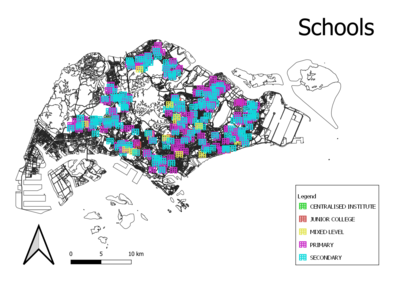
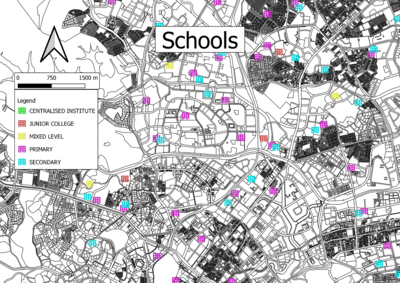
| − | The schools | + | The cartographic technique used to categorize the schools by their main_level was hue. That is because the main_level attribute is a nominal data. Point symbols are the best for schools because it would be able to pinpoint their exact location. |
== Part 2 Choropleth Mapping == | == Part 2 Choropleth Mapping == | ||
Revision as of 18:08, 15 September 2019
Part 1: Thematic Mapping
The cartographic technique used to categorize the schools by their main_level was hue. That is because the main_level attribute is a nominal data. Point symbols are the best for schools because it would be able to pinpoint their exact location.

