Difference between revisions of "SMT201 AY2019-20G2 Ex1 Soh Bai He"
| Line 21: | Line 21: | ||
=== Road Network System === | === Road Network System === | ||
| − | [[File:P1b-roadnetwork.jpg|700px|thumb|left|Data Source: mytransport.sg / File: RoadSectionLine.shp]] | + | [[File:P1b-roadnetwork.jpg|700px|thumb|left|Data Source: mytransport.sg / File: RoadSectionLine.shp]]<br> |
| + | '''Data Handling & Choice of Classification:''' RoadSectionLine.shp is exported into .csv format and new columns RD_CAT_NO, RD_MAIN_CAT, RD_SUB_CAT are added on excel (road-section-category-sorted.csv). Roads are then categorised with reference to [https://www.ura.gov.sg/-/media/Corporate/Resources/Publications/Streets-and-Building-Names/SBNB_handbook_streets.pdf?la=en Urban Redevelopment Authority’s Handbook on Guidelines] for Naming of Streets. Thereafter, I analysed the remaining roads (that do not include the street name descriptors in Table 1) on the OpenStreetMap and grouped them into Arterial/Primary Access as they are minor roads that provide access to developments.<br><br> | ||
| + | |||
| + | '''Visual Variable:''' Line symbols with different colours are used to represent each road type. A warm colour scheme (red > orange > yellow > white) is chosen to highlight the hierarchy of road types. Expressway is given the thickest width as they form the primary network.<br><br> | ||
| + | |||
=== 2014 Master Plan Landuse === | === 2014 Master Plan Landuse === | ||
Revision as of 17:35, 15 September 2019
Contents
Part One: Thematic Mapping
Public Education Institutions
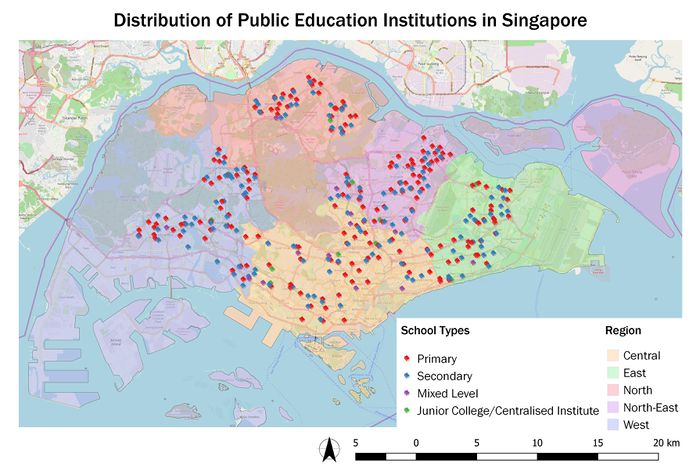
Data Handling: general-information-of-schools.csv is geocoded into school_information.shp
Choice of Classification:
1) Categorisation by school type. Junior College and Centralised Institute are grouped together as both offers pre-university courses and lead to the ‘A’ Level examinations.
2) Categorisation by region to facilitate easier visualisation of the distribution of schools by region.
Visual Variable: An SVG marker of a book is used as the symbol. Different colours are used for each school type/region for easier identification.
Feature count: Total (344), Primary (181), Secondary (138), Mixed Level (14), Junior College/Centralised Institute (11)
Observation: Of all school types, Junior College/Centralised Institute has the least number. However, the existing ones are well distributed across Singapore with every region covered.
Road Network System
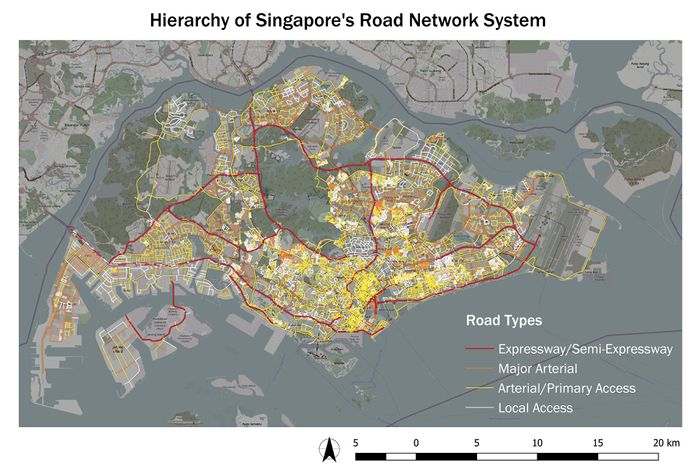
Data Handling & Choice of Classification: RoadSectionLine.shp is exported into .csv format and new columns RD_CAT_NO, RD_MAIN_CAT, RD_SUB_CAT are added on excel (road-section-category-sorted.csv). Roads are then categorised with reference to Urban Redevelopment Authority’s Handbook on Guidelines for Naming of Streets. Thereafter, I analysed the remaining roads (that do not include the street name descriptors in Table 1) on the OpenStreetMap and grouped them into Arterial/Primary Access as they are minor roads that provide access to developments.
Visual Variable: Line symbols with different colours are used to represent each road type. A warm colour scheme (red > orange > yellow > white) is chosen to highlight the hierarchy of road types. Expressway is given the thickest width as they form the primary network.
