Difference between revisions of "SMT201 AY2019-20G2 Ex1 Soh Bai He"
| Line 8: | Line 8: | ||
<br><br> | <br><br> | ||
'''Choice of Classification:''' | '''Choice of Classification:''' | ||
| − | 1) Categorisation by school type. Junior College and Centralised Institute are grouped together as both offers pre-university courses and lead to the ‘A’ Level examinations. | + | 1) Categorisation by school type. Junior College and Centralised Institute are grouped together as both offers pre-university courses and lead to the ‘A’ Level examinations.<br> |
2) Categorisation by region to facilitate easier visualisation of the distribution of schools by region. | 2) Categorisation by region to facilitate easier visualisation of the distribution of schools by region. | ||
<br><br> | <br><br> | ||
| Line 15: | Line 15: | ||
'''Feature count:''' Total (344), Primary (181), Secondary (138), Mixed Level (14), Junior College/Centralised Institute (11) | '''Feature count:''' Total (344), Primary (181), Secondary (138), Mixed Level (14), Junior College/Centralised Institute (11) | ||
<br><br> | <br><br> | ||
| − | '''Observation:''' Of all school types, Junior College/Centralised | + | '''Observation:''' Of all school types, Junior College/Centralised Institute has the least number. However, the existing ones are well distributed across Singapore with every region covered. |
| − | <br><Br | + | <br><Br> |
Revision as of 16:55, 15 September 2019
Contents
Part One: Thematic Mapping
=== Public Education Institutions ===
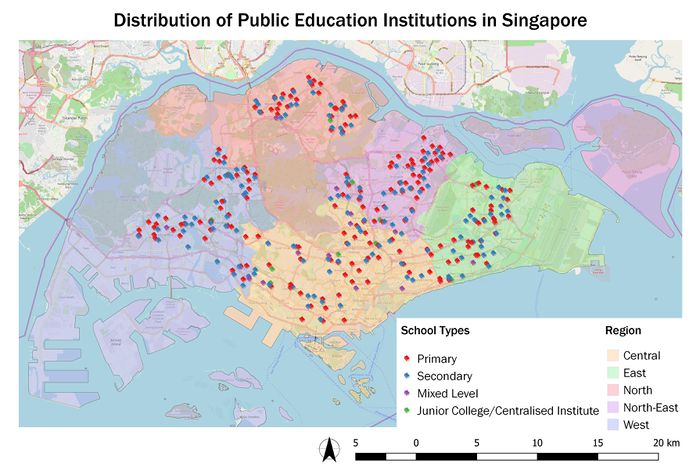
Data Handling: general-information-of-schools.csv is geocoded into school_information.shp
Choice of Classification:
1) Categorisation by school type. Junior College and Centralised Institute are grouped together as both offers pre-university courses and lead to the ‘A’ Level examinations.
2) Categorisation by region to facilitate easier visualisation of the distribution of schools by region.
Visual Variable: An SVG marker of a book is used as the symbol. Different colours are used for each school type/region for easier identification.
Feature count: Total (344), Primary (181), Secondary (138), Mixed Level (14), Junior College/Centralised Institute (11)
Observation: Of all school types, Junior College/Centralised Institute has the least number. However, the existing ones are well distributed across Singapore with every region covered.
