Difference between revisions of "G2-Group09 Proposal"
| (8 intermediate revisions by one other user not shown) | |||
| Line 1: | Line 1: | ||
[[File:Proposal.png|1000px|center]] | [[File:Proposal.png|1000px|center]] | ||
| + | |||
<!--Header--> | <!--Header--> | ||
| Line 25: | Line 26: | ||
|} | |} | ||
<!--/Header--> | <!--/Header--> | ||
| + | |||
| + | |||
| + | <!--/About Hsinchu--> | ||
| + | {| border="1" cellpadding="1" | ||
| + | |- style="background-color:#FF69B4; color: white; height:40px; text-align: center; margin: 0 auto" | ||
| + | ! style="width:1600px"| About Hsinchu, Taiwan | ||
| + | |} | ||
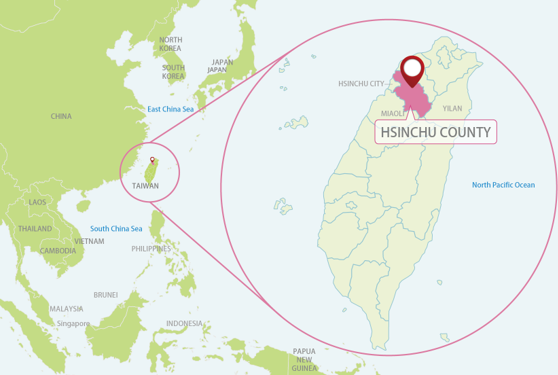
| + | Hsinchu County is located in Taiwan, homed for the largest Hakka community. Hsinchu County have seen a thriving economy with the support of their Hsinchu Science Park and Hsinchu Industrial Park. The government vigorously promoted growth of the county through infrastructure building, the development of Hsinchu Biomedical Science Park, High Speed Rail (HSR) Hsinchu Station special district and many more. These developments give Hsinchu a competitive edge in scientific fields as well as promotes growth into the region. | ||
| + | <br> | ||
| + | <br> | ||
| + | [[File:Hsinchucounty.png|center]] | ||
| + | <br> | ||
| + | <!--/About Hsinchu--> | ||
| + | |||
| + | |||
| + | <!--/Project Motivation--> | ||
| + | {| border="1" cellpadding="1" | ||
| + | |- style="background-color:#FF69B4; color: white; height:40px; text-align: center; margin: 0 auto" | ||
| + | ! style="width:1600px"| Project Motivation | ||
| + | |} | ||
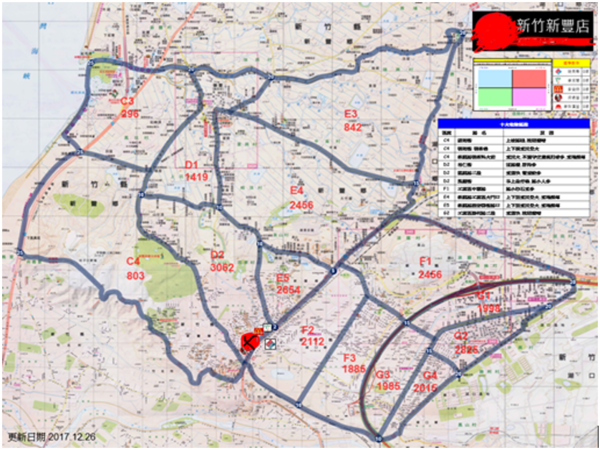
| + | The international fast food franchise we are working with have already been in Taiwan since 1986. This means that our client has ample information about their competitors as well as various factors around their stores that can affect the sales of each of their stores in Taiwan. However, our client failed to optimize this information they possessed and analyze these factors using trade area in PowerPoint. These trade areas are stagnant and will not account for any future changes that will inevitably occur around their stores. This mean that if they would like to analyze a trade area and if there is changes around their stores, they would need to redo the whole trade area in PowerPoint, which is very inefficient and time-consuming. Also, analyzing trade areas in PowerPoint will make it hard for our client to analyze the relationship between one trade area and another, and, it will be hard for them to find out in the event where there is an overlapping between trade areas. If there is an overlap between trade areas our client is not aware of, they will fail to allocate their resources properly which can lead to inefficient use of their resources. | ||
| + | <br> | ||
| + | <br> | ||
| + | [[File:Sample.png|600px|center]] | ||
| + | <br><br> | ||
| + | Due to all this inefficiency in the way our client analyze their trade areas, we are motivated to help them better analyze their trade areas by putting all their trade areas into a QGIS platform and help them better understand the different factors that will affect the sales of each store and if applicable, give them suggestions on ways that they will be able to improve their sales and also ways to better generate their trade areas. | ||
| + | <br><br> | ||
| + | Besides being able to help our client analyze the factors that can affect the sales of their stores, this is also a great chance for us to put the QGIS skills we learn in school and get a first-hand experience to learn about how business analysis in QGIS happen in the real world. We believe that through this experience, we will be able to better understand how each QGIS tool works and its application to various business geospatial analysis. | ||
| + | |||
| + | <!--/Project Motivation--> | ||
| + | |||
| + | |||
| + | <!--/Project Objective--> | ||
| + | {| border="1" cellpadding="1" | ||
| + | |- style="background-color:#FF69B4; color: white; height:40px; text-align: center; margin: 0 auto" | ||
| + | ! style="width:1600px"| Project Objective | ||
| + | |} | ||
| + | This project aims to provide the relevant information for our client to improve their business operation in Hsinchu, Taiwan. Our analysis includes:<br><br> | ||
| + | 1.Analysis on different trade area generation methods (e.g. buffering, drivetime) to determine which method our client should use to generate their trade areas in future analysis.<br> | ||
| + | 2.Analysis of population density effect on our client’s sales.<br> | ||
| + | 3.Analysis of close competitors (e.g. Types: Fast Food, Pizza, Italian Food) near each our client’s store and the effect of the concentration of competitors surrounding the store and their proximity on our client’s sales.<br> | ||
| + | 4.Multiple regression analysis on relevant point of interest as independent variables (e.g. cinema, business facility, government office) and our client’s sales as dependent variable to study the relationship between them.<br> | ||
| + | 5.Analysis on the mix of point of interests within trade area of each our client’s store and its effect on our client’s sales.<br> | ||
| + | 6.Analysis on the feasibility of suggested new storefront for our client’s using GIS-based multi-criteria analysis. (KIV)<br> | ||
| + | <br><br> | ||
| + | We aim to provide not just surface analysis of our client, but to also dive deeper and find out more underlying factors that will affect our client’s operation and sales in Hsinchu, Taiwan. Through our analysis in this report, we hope to provide relevant insights as well as applicable recommendations to aid our client’s business operation in Taiwan. | ||
| + | |||
| + | <!--/Project Objective--> | ||
| + | |||
| + | |||
| + | <!--/Timeline--> | ||
| + | {| border="1" cellpadding="1" | ||
| + | |- style="background-color:#FF69B4; color: white; height:40px; text-align: center; margin: 0 auto" | ||
| + | ! style="width:1600px"| Project Timeline | ||
| + | |} | ||
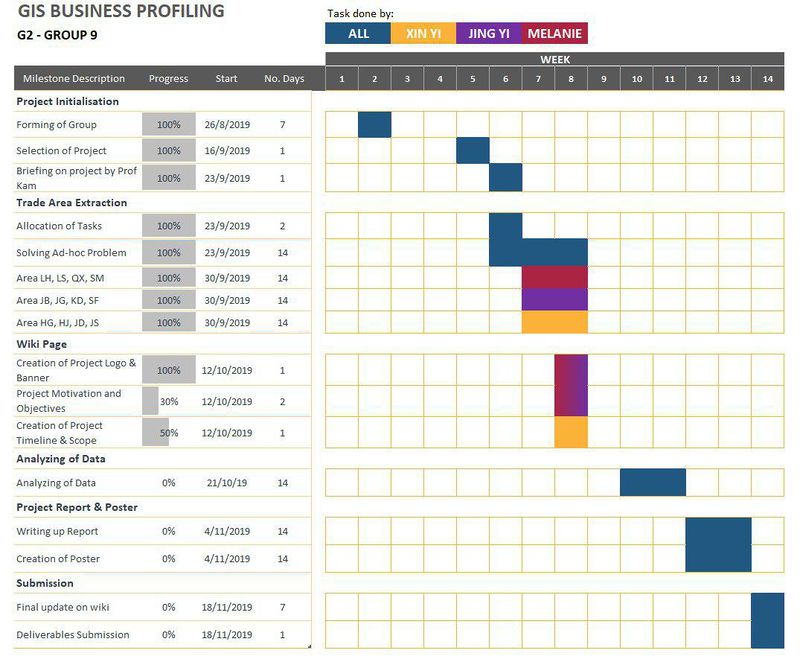
| + | <br> | ||
| + | [[File:TimelineVer1.jpg|800px|center]] | ||
| + | <!--/Timeline--> | ||
Latest revision as of 05:27, 25 November 2019
| HOME | PROJECT REPORT |
| About Hsinchu, Taiwan |
|---|
Hsinchu County is located in Taiwan, homed for the largest Hakka community. Hsinchu County have seen a thriving economy with the support of their Hsinchu Science Park and Hsinchu Industrial Park. The government vigorously promoted growth of the county through infrastructure building, the development of Hsinchu Biomedical Science Park, High Speed Rail (HSR) Hsinchu Station special district and many more. These developments give Hsinchu a competitive edge in scientific fields as well as promotes growth into the region.
| Project Motivation |
|---|
The international fast food franchise we are working with have already been in Taiwan since 1986. This means that our client has ample information about their competitors as well as various factors around their stores that can affect the sales of each of their stores in Taiwan. However, our client failed to optimize this information they possessed and analyze these factors using trade area in PowerPoint. These trade areas are stagnant and will not account for any future changes that will inevitably occur around their stores. This mean that if they would like to analyze a trade area and if there is changes around their stores, they would need to redo the whole trade area in PowerPoint, which is very inefficient and time-consuming. Also, analyzing trade areas in PowerPoint will make it hard for our client to analyze the relationship between one trade area and another, and, it will be hard for them to find out in the event where there is an overlapping between trade areas. If there is an overlap between trade areas our client is not aware of, they will fail to allocate their resources properly which can lead to inefficient use of their resources.
Due to all this inefficiency in the way our client analyze their trade areas, we are motivated to help them better analyze their trade areas by putting all their trade areas into a QGIS platform and help them better understand the different factors that will affect the sales of each store and if applicable, give them suggestions on ways that they will be able to improve their sales and also ways to better generate their trade areas.
Besides being able to help our client analyze the factors that can affect the sales of their stores, this is also a great chance for us to put the QGIS skills we learn in school and get a first-hand experience to learn about how business analysis in QGIS happen in the real world. We believe that through this experience, we will be able to better understand how each QGIS tool works and its application to various business geospatial analysis.
| Project Objective |
|---|
This project aims to provide the relevant information for our client to improve their business operation in Hsinchu, Taiwan. Our analysis includes:
1.Analysis on different trade area generation methods (e.g. buffering, drivetime) to determine which method our client should use to generate their trade areas in future analysis.
2.Analysis of population density effect on our client’s sales.
3.Analysis of close competitors (e.g. Types: Fast Food, Pizza, Italian Food) near each our client’s store and the effect of the concentration of competitors surrounding the store and their proximity on our client’s sales.
4.Multiple regression analysis on relevant point of interest as independent variables (e.g. cinema, business facility, government office) and our client’s sales as dependent variable to study the relationship between them.
5.Analysis on the mix of point of interests within trade area of each our client’s store and its effect on our client’s sales.
6.Analysis on the feasibility of suggested new storefront for our client’s using GIS-based multi-criteria analysis. (KIV)
We aim to provide not just surface analysis of our client, but to also dive deeper and find out more underlying factors that will affect our client’s operation and sales in Hsinchu, Taiwan. Through our analysis in this report, we hope to provide relevant insights as well as applicable recommendations to aid our client’s business operation in Taiwan.
| Project Timeline |
|---|


