Difference between revisions of "G2-Group14 Proposal"
| Line 366: | Line 366: | ||
| + | |} | ||
| + | |||
| + | <br> | ||
| + | |||
| + | {| align=center width = 100%| border = "1" cellpadding = "1" | ||
| + | |||
| + | ! style="text-align: center; width:20em; height: 3em; font-size:20px; font-family:Arial !important;; background-color:#132569; color: white;"| FUNCTIONS AND ANALYSIS | ||
| + | |} | ||
| + | |||
| + | <!-- DATA TABLE CONTENT --> | ||
| + | |||
| + | {| width=99% border=3 align=center font-family:Cambria | ||
| + | ! style="text-align: center; font-weight:bold; font-size:22px; background-color: rgb(77, 166, 255);" | Functions Employed | ||
| + | ! style="text-align: center; font-weight:bold; font-size:22px; background-color: rgb(77, 166, 255);" | Analysis Conducted | ||
| + | |||
| + | |- | ||
| + | | style="background-color:white" | Choropleth Mapping | ||
| + | | style="text-align: left;" | | ||
| + | *Revenue Analysis for each of the allocated stores | ||
| + | *Revenue Analysis for each POD in their trade areas | ||
| + | |- | ||
| + | |||
| + | |- | ||
| + | | style="background-color:white" | Count by Polygon – the generation of the 32 main POI variables | ||
| + | | style="text-align: left;" | | ||
| + | *Generation of the Business Profiles for the stores | ||
| + | *Relationship between the Total Number of POIs and Revenue | ||
| + | |- | ||
| + | |||
| + | |- | ||
| + | | style="background-color:white" | Network OD-Matrix (Layers as Table (M:N)) | ||
| + | | style="text-align: left;" | | ||
| + | *Relationship between the Average Shortest Distance of the POIs from the stores and Revenue | ||
| + | |- | ||
| + | |||
| + | |- | ||
| + | | style="background-color:white" | Multi-Linear Regression (using SAS Enterprise Guide) | ||
| + | | style="text-align: left;" | | ||
| + | *Relationship between Important Variables and Revenue | ||
| + | |- | ||
| + | |||
| + | |- | ||
| + | | style="background-color:white" | Linear Regression (using SAS Enterprise Guide) | ||
| + | | style="text-align: left;" | | ||
| + | *Relationship between Area of Trade and Revenue | ||
| + | |- | ||
| + | |||
| + | |- | ||
| + | | style="background-color:white" | Hub Lines / Distance | ||
| + | | style="text-align: left;" | | ||
| + | *Relationship between Competitors and Revenue | ||
| + | |- | ||
| + | |||
| + | |- | ||
| + | | style="background-color:white" | Buffer Generation for 2.5KM, 3.0KM and 3.5KM | ||
| + | | style="text-align: left;" | | ||
| + | *Analysis of the use of Buffers as a Theoretical Trade Area | ||
| + | |- | ||
| + | |||
| + | |- | ||
| + | | style="background-color:white" | Iso-Areas as Contours (from Layer) | ||
| + | | style="text-align: left;" | | ||
| + | *Analysis of the use of Network Service Area as a Theoretical Trade Area 8 | ||
| + | *Comparison between the use of Theoretical Trade Areas and the Actual Digitised Trade Areas | ||
| + | |- | ||
| + | |||
| + | |- | ||
| + | | colspan="4" style="font-style: bold; font-size:20px; font-family: Cambria; background-color: rgb(179, 215, 255);text-align: center;" | Errors | ||
| + | |- | ||
| + | |||
| + | |||
| + | |- | ||
| + | | style="background-color:white" |- | ||
| + | | style="text-align: left;" | | ||
| + | *Data gap discovered for the Population Data | ||
| + | |- | ||
|} | |} | ||
| Line 376: | Line 452: | ||
{| align=center width = 100%| border = "1" cellpadding = "1" | {| align=center width = 100%| border = "1" cellpadding = "1" | ||
| − | ! style="text-align: center; width:20em; height: 3em; font-size:20px; font-family:Arial !important;; background-color:#132569; color: white;"| | + | ! style="text-align: center; width:20em; height: 3em; font-size:20px; font-family:Arial !important;; background-color:#132569; color: white;"| FUNCTIONS USED |
|} | |} | ||
Revision as of 23:08, 24 November 2019
| PROJECT MOTIVATION |
|---|
|
Big Data, in today’s context, is indispensable. Businesses are realising its importance and how they should utilize data they have captured over the years by applying analytics. Over the years, Big Data analytics has helped organisations process their data; discovering insights, trends and uncovering potential opportunities. This has benefited these organisations by improving their decision-making and problem solving processes. When the opportunity to work with an international restaurant franchise arose, our team was more than keen to take on the challenge. With the relevant data readily provided by our client, we will then employ skills like delineating and digitizing the trade areas of our allocated stores, then analyse how other relevant factors such as competitions and human traffic can affect their business across Taipei. In this project, we are excited to apply skill sets that we have acquired in our Geospatial classes to help identify potential hotspots and potential problems that might be occurring. We hope that our analysis can provide the client with valuable insights, and that our proposed recommendations can aid them with their business strategies and decisions in the coming years.
|
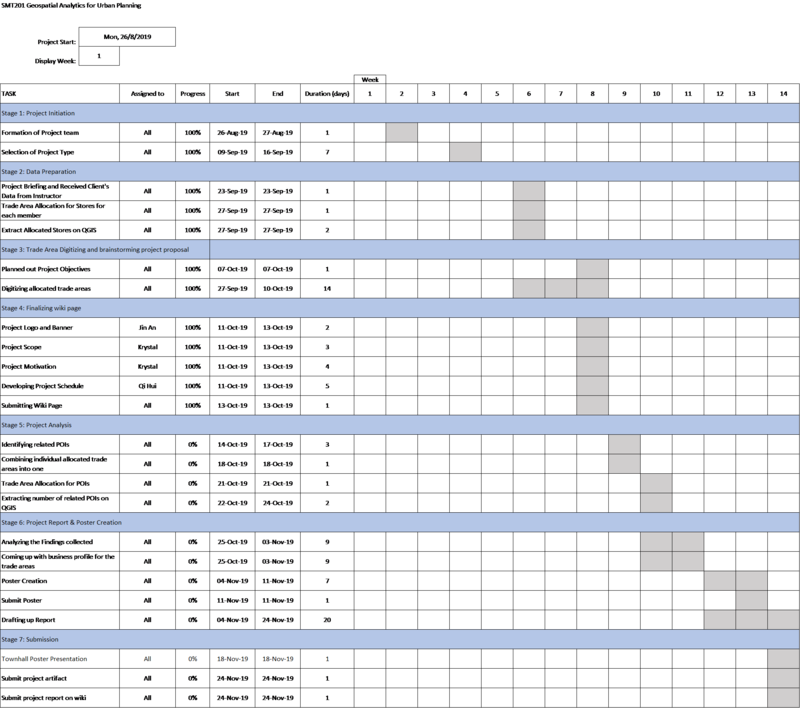
||||||||||||||||||||||||||||||||||||||||||||||||||||||||||||||||||||||||||||||||||||||||||||||||||||||||||||||||||||||||||||||||||||||||||||||||||||||||||||||||||||||||||||||||||||||||||||||||||||||||||||||||||||||||||||||||||||||||||||||||||||||||||||||||||||||||||||||||||||||||||||||||||||||||||||||||||||


