Difference between revisions of "G1-Group02"
| (13 intermediate revisions by 3 users not shown) | |||
| Line 3: | Line 3: | ||
{| style="margin: 3px 10px 3px 10px; width="100%"| | {| style="margin: 3px 10px 3px 10px; width="100%"| | ||
| − | | style="font-family: sans-serif; font-size:14px;font-weight:bold; text-align: center; border-width:1px; border-top: | + | | style="font-family: sans-serif; font-size:14px;font-weight:bold; text-align: center; border-width:1px; border-top:3px solid #898d89; border-bottom:3px solid #898d89" width="10%" | |
[[G1-Group02|<font color="#89440a">PROPOSAL</font>]] | [[G1-Group02|<font color="#89440a">PROPOSAL</font>]] | ||
| Line 20: | Line 20: | ||
The increasing use of big data has created new means and tools for businesses to make more informed choices and decisions. Businesses should maximize their use of these analytical tools to help them bridge the gap between data and decision-making, so that they can maintain a competitive edge and stay relevant in the market. However, not all business have the resources, capability or expertise to do so. | The increasing use of big data has created new means and tools for businesses to make more informed choices and decisions. Businesses should maximize their use of these analytical tools to help them bridge the gap between data and decision-making, so that they can maintain a competitive edge and stay relevant in the market. However, not all business have the resources, capability or expertise to do so. | ||
| − | Our team decided to engage in this project as we are interested to help businesses connect the data that they have already collected and is readily available to their business operations and decision-making process. Our team hopes to make use of the geospatial analysis techniques and skills taught in class to assist our client in analyzing their data and propose meaningful business recommendations to them. Our team is | + | Our team decided to engage in this project as we are interested to help businesses connect the data that they have already collected and is readily available to their business operations and decision-making process. Our team hopes to make use of the geospatial analysis techniques and skills taught in class to assist our client in analyzing their data and propose meaningful business recommendations to them. |
| + | |||
| + | Our team is interested to compare the differences between (1) using radius of 2.5km, 3km and 3.5km from the store to determine operating areas, and (2) using drive time from store to determine operating areas. We would also like to identify and uncover any hidden relationships that might be affecting each stores' overall profitability. We hope that through this project, our team is able to not only learn invaluable skills that are related to geospatial analytics, but is able to also learn more about working for a real life project with business clients. | ||
The team consists of Brendan Ong Sin Kai, Chong Yun Yu and Heng Bing Chow, three students from the Associate Professor of Information Systems (Practice), Dr. Kam Tin Seong's Geographic Information Systems for Urban Planning class in the School of Information Systems at Singapore Management University in Academic Year 2019-20 Semester 1. | The team consists of Brendan Ong Sin Kai, Chong Yun Yu and Heng Bing Chow, three students from the Associate Professor of Information Systems (Practice), Dr. Kam Tin Seong's Geographic Information Systems for Urban Planning class in the School of Information Systems at Singapore Management University in Academic Year 2019-20 Semester 1. | ||
| Line 28: | Line 30: | ||
* Create digitized maps on Geographic Information System (GIS) software that corresponds to the location maps provided by our client | * Create digitized maps on Geographic Information System (GIS) software that corresponds to the location maps provided by our client | ||
* Conduct detailed analysis for each store’s business profile based on the points of interests (POIs) within their trading zones and sub-zones | * Conduct detailed analysis for each store’s business profile based on the points of interests (POIs) within their trading zones and sub-zones | ||
| − | * Provide business recommendations to our client | + | * Provide business recommendations to our client regarding the optimal trade area boundaries to have for each store, by comparing their current service areas with 2.5km, 3km and 3.5km radius service areas, as well as service areas determined by drive time |
| + | * Identify potential hot spots for our client to consider setting up stores in | ||
Our team aims to produce the following '''deliverables''' by the end of our project: | Our team aims to produce the following '''deliverables''' by the end of our project: | ||
| Line 47: | Line 50: | ||
=<div style="margin-top: 10px;font-family: Arial;font-weight:bold;text-align:center;font-size:18px; border: 5px solid #00000000; border-radius:8px;text-align:center; background-color: #ffef8e; color: black; padding: 2px"><span style="font-size:24px;"></span>Project Scope</div>= | =<div style="margin-top: 10px;font-family: Arial;font-weight:bold;text-align:center;font-size:18px; border: 5px solid #00000000; border-radius:8px;text-align:center; background-color: #ffef8e; color: black; padding: 2px"><span style="font-size:24px;"></span>Project Scope</div>= | ||
| − | Our client for this project is a Food & Beverage (F&B) giant that operates in multiple countries worldwide. For this project, our team will be focusing on | + | Our client for this project is a Food & Beverage (F&B) giant that operates in multiple countries worldwide. For this project, our team will be focusing on 11 branches in Taiwan, specifically all the branches of the F&B chain that are located along the East Coast of Taiwan. These branches are located in 4 different counties, namely Keelung, Nantou, Hualien and Taitung. |
| − | Since our allocated stores are scattered from the North to the South of the East side of Taiwan, we would like to identify any correlations between the location of the stores and the stores' reachability and profitability, based on the | + | Since our allocated stores are scattered from the North to the South of the East side of Taiwan, we would like to identify any correlations between the location of the stores and the stores' reachability and profitability, based on the sales numbers and revenue for each trading zone, and the location of different POIs located within their respective trade areas that were provided by our client. We would also like to check if distance of the POIs from the store would directly impact the profitability of the stores as well. Furthermore, we aim to provide business recommendations to our client and identify potential hot-spots based on the results of our analysis. |
| − | The stores that were assigned to our team are HN, HZ, Jenyi (JI), Ji An (JA), Keelung Shensi (KG) | + | The stores that were assigned to our team are HN, HZ, Jenyi (JI), Ji An (JA), Keelung Shensi (KG), Nantou Nangang (NN), Nantou Puli (PL), TD, Tsao-Tung (TT), UL, ZU (Jhushan Township). Amongst the stores that were allocated to our team, we had a mix of stores that were currently in operation, as well as stores that has ceased operation. Only two stores, Jenyi (JI) and Tsao-Tung (TT), are currently not in operation anymore. |
The breakdown of stores according to their counties is as the following: | The breakdown of stores according to their counties is as the following: | ||
| − | * Keelung: Keelung Shensi (KG) | + | * Keelung: Keelung Shensi (KG), Jenyi (JI) |
| − | * Nantou: Nantou Nangang (NN), Nantou Puli (PL), Tsao-Tung (TT) | + | * Nantou: Nantou Nangang (NN), Nantou Puli (PL), Tsao-Tung (TT), ZU (Jhushan Township) |
* Hualien: HN, HZ, Ji An (JA), UL | * Hualien: HN, HZ, Ji An (JA), UL | ||
* Taitung: TD | * Taitung: TD | ||
| − | + | [[File:Store Location (All Existing Stores Only).jpg|1000px|frameless|center|G1 Group 2 Store Location]] | |
| − | [[File:Store Location | ||
| − | |||
Data Source: Taiwan_stores.gpkg from Dr. Kam and County MOI from our client | Data Source: Taiwan_stores.gpkg from Dr. Kam and County MOI from our client | ||
| Line 111: | Line 112: | ||
|- | |- | ||
| ZU-20171213寬100高100(細木框) || Contain service area of store || PPTX || Client || Reference Layer for Digitising | | ZU-20171213寬100高100(細木框) || Contain service area of store || PPTX || Client || Reference Layer for Digitising | ||
| + | |- | ||
| + | |-style= "background-color: #fffadb" | ||
| + | !scope="row" colspan="5" style= "background-color: #fffadb"|<b>''Map Release''</b> | ||
| + | |- | ||
| + | | Map Releases - Taiwan (TWN) v181G0 Release Notes || Contains Taiwan map release notes || PDF || Client || Reference Material for Analysis | ||
|- | |- | ||
|-style= "background-color: #fffadb" | |-style= "background-color: #fffadb" | ||
| Line 192: | Line 198: | ||
|- | |- | ||
| TravDest || Shows travel destinations, such as hotels in South Taiwan || SHP || Client || Reference Layer for Analysis | | TravDest || Shows travel destinations, such as hotels in South Taiwan || SHP || Client || Reference Layer for Analysis | ||
| + | |-style= "background-color: #fffadb" | ||
| + | !scope="row" colspan="5" style= "background-color: #fffadb"|<b>''Sales Data''</b> | ||
| + | |- | ||
| + | | Store_sales_data || Shows Sales Revenue, Sales No., and Average Sales Revenue per Sales No. in Taiwan || CSV || Dr. Kam || Reference Layer for Analysis | ||
|} | |} | ||
| Line 197: | Line 207: | ||
Our team decided to take the following '''steps''' in order to meet the objectives that we set: | Our team decided to take the following '''steps''' in order to meet the objectives that we set: | ||
| − | :1. Digitize | + | :1.Define service areas for each store<br> |
| − | :2. Extract relevant POIs, which include <br> | + | ::a. Digitize current service areas and sub-areas for each store according to location map provided by our client<br> |
| + | ::b. Delineate service areas for each store according to 2.5km, 3km and 3.5km radius from the stores<br> | ||
| + | ::c. Delineate service areas for each store according to drive time from the stores<br> | ||
| + | :2. Extract 32 relevant POIs, which include <br> | ||
:<table> | :<table> | ||
| Line 204: | Line 217: | ||
<ul> | <ul> | ||
<td><li> </li></td> | <td><li> </li></td> | ||
| − | <td><li>ATM | + | <td><li>ATM 3578</li></td> |
<td><li> </li></td> | <td><li> </li></td> | ||
| − | <td> <li> | + | <td> <li>HIGHER EDUCATION 8200</li></td> |
</ul> | </ul> | ||
</tr> | </tr> | ||
| Line 213: | Line 226: | ||
<ul> | <ul> | ||
<td><li> </li></td> | <td><li> </li></td> | ||
| − | <td><li>BANK | + | <td><li>BANK 6000</li></td> |
<td><li> </li></td> | <td><li> </li></td> | ||
| − | <td> <li> | + | <td> <li>HOSPITAL 8060</li></td> |
</ul> | </ul> | ||
</tr> | </tr> | ||
| Line 222: | Line 235: | ||
<ul> | <ul> | ||
<td><li> </li></td> | <td><li> </li></td> | ||
| − | <td><li>BAR OR PUB | + | <td><li>BAR OR PUB 9532</li></td> |
<td><li> </li></td> | <td><li> </li></td> | ||
| − | <td> <li> | + | <td> <li>HOTEL 7011</li></td> |
</ul> | </ul> | ||
</tr> | </tr> | ||
| Line 231: | Line 244: | ||
<ul> | <ul> | ||
<td><li> </li></td> | <td><li> </li></td> | ||
| − | <td><li>BOOKSTORE | + | <td><li>BOOKSTORE 9995</li></td> |
<td><li> </li></td> | <td><li> </li></td> | ||
| − | <td> <li> | + | <td> <li>INDUSTRIAL ZONE 9991</li></td> |
</ul> | </ul> | ||
</tr> | </tr> | ||
| Line 240: | Line 253: | ||
<ul> | <ul> | ||
<td><li> </li></td> | <td><li> </li></td> | ||
| − | <td><li>BOWLING CENTRE | + | <td><li>BOWLING CENTRE 7933</li></td> |
<td><li> </li></td> | <td><li> </li></td> | ||
| − | <td> <li> | + | <td> <li>MEDICAL SERVICE 9583</li></td> |
</ul> | </ul> | ||
</tr> | </tr> | ||
| Line 249: | Line 262: | ||
<ul> | <ul> | ||
<td><li> </li></td> | <td><li> </li></td> | ||
| − | <td><li>BUS STATION | + | <td><li>BUS STATION 4170</li></td> |
<td><li> </li></td> | <td><li> </li></td> | ||
| − | <td> <li> | + | <td> <li>NIGHTLIFE 5813</li></td> |
</ul> | </ul> | ||
</tr> | </tr> | ||
| Line 258: | Line 271: | ||
<ul> | <ul> | ||
<td><li> </li></td> | <td><li> </li></td> | ||
| − | <td><li>BUSINESS FACILITY | + | <td><li>BUSINESS FACILITY 5000</li></td> |
<td><li> </li></td> | <td><li> </li></td> | ||
| − | <td> <li> | + | <td> <li>PERFORMING ARTS 7929</li></td> |
</ul> | </ul> | ||
</tr> | </tr> | ||
| Line 267: | Line 280: | ||
<ul> | <ul> | ||
<td><li> </li></td> | <td><li> </li></td> | ||
| − | <td><li>CINEMA | + | <td><li>CINEMA 7832</li></td> |
<td><li> </li></td> | <td><li> </li></td> | ||
| − | <td> <li> | + | <td> <li>PHARMACY 9565</li></td> |
</ul> | </ul> | ||
</tr> | </tr> | ||
| Line 276: | Line 289: | ||
<ul> | <ul> | ||
<td><li> </li></td> | <td><li> </li></td> | ||
| − | <td><li>CLOTHING STORE | + | <td><li>CLOTHING STORE 9537</li></td> |
<td><li> </li></td> | <td><li> </li></td> | ||
| − | <td> <li> | + | <td> <li>RESIDENTIAL AREA/BUILDING 9590</li></td> |
</ul> | </ul> | ||
</tr> | </tr> | ||
| Line 285: | Line 298: | ||
<ul> | <ul> | ||
<td><li> </li></td> | <td><li> </li></td> | ||
| − | <td><li>COFFEE SHOP | + | <td><li>COFFEE SHOP 9996</li></td> |
<td><li> </li></td> | <td><li> </li></td> | ||
| − | <td> <li> | + | <td> <li>RESTAURANT 5800</li></td> |
</ul> | </ul> | ||
</tr> | </tr> | ||
| Line 294: | Line 307: | ||
<ul> | <ul> | ||
<td><li> </li></td> | <td><li> </li></td> | ||
| − | <td><li>COMMUTER RAIL STATION | + | <td><li>COMMUTER RAIL STATION 4100</li></td> |
<td><li> </li></td> | <td><li> </li></td> | ||
| − | <td> <li> | + | <td> <li>SCHOOL 8211</li></td> |
</ul> | </ul> | ||
</tr> | </tr> | ||
| Line 303: | Line 316: | ||
<ul> | <ul> | ||
<td><li> </li></td> | <td><li> </li></td> | ||
| − | <td><li>CONSUMER ELECTRONICS STORE | + | <td><li>CONSUMER ELECTRONICS STORE 9987</li></td> |
<td><li> </li></td> | <td><li> </li></td> | ||
| − | <td> <li> | + | <td> <li>SHOPPING 6512</li></td> |
</ul> | </ul> | ||
</tr> | </tr> | ||
| Line 312: | Line 325: | ||
<ul> | <ul> | ||
<td><li> </li></td> | <td><li> </li></td> | ||
| − | <td><li>CONVENIENCE STORE | + | <td><li>CONVENIENCE STORE 9535</li></td> |
<td><li> </li></td> | <td><li> </li></td> | ||
| − | <td> <li> | + | <td> <li>SPECIALITY STORE 9567</li></td> |
</ul> | </ul> | ||
</tr> | </tr> | ||
| Line 321: | Line 334: | ||
<ul> | <ul> | ||
<td><li> </li></td> | <td><li> </li></td> | ||
| − | <td><li>DEPARTMENT STORE | + | <td><li>DEPARTMENT STORE 9545</li></td> |
| + | <td><li> </li></td> | ||
| + | <td> <li>SPORTS CENTRE 7997</li></td> | ||
| + | </ul> | ||
| + | </tr> | ||
| + | <tr> | ||
| + | <ul> | ||
| + | <td><li> </li></td> | ||
| + | <td><li>GOVERNMENT OFFICE 9525</li></td> | ||
| + | <td><li> </li></td> | ||
| + | <td> <li>SPORTS COMPLEX 7940</li></td> | ||
| + | </ul> | ||
| + | </tr> | ||
| + | <tr> | ||
| + | <ul> | ||
| + | <td><li> </li></td> | ||
| + | <td><li>GROCERY STORE 5400</li></td> | ||
<td><li> </li></td> | <td><li> </li></td> | ||
| − | <td> <li>TRAIN STATION | + | <td> <li>TRAIN STATION 4013</li></td> |
</ul> | </ul> | ||
</tr> | </tr> | ||
| Line 329: | Line 358: | ||
</table> | </table> | ||
| − | |||
| − | 4. Perform analysis on | + | 3. Clip POIs onto the three different types of defined service areas for each store<br> |
| + | |||
| + | 4. Perform analysis on all stores according to the different types of defined trading zones | ||
:* Tabulate number of each POI and calculate percentage of each POI relative to total number of POIs in the respective areas | :* Tabulate number of each POI and calculate percentage of each POI relative to total number of POIs in the respective areas | ||
| − | :* | + | :* Perform correlation analysis on both the number of POIs in the trade areas and distance of POIs from the stores against the sales numbers and revenue |
| − | :* | + | :* Compare differences between the three different types of defined trading zones |
| + | :* Conduct DBSCAN clustering analysis<br> | ||
| + | |||
| − | 5. | + | 5. Derive insights and consolidate project into organised data files, data dictionary, poster and report <br> |
| − | |||
| − | |||
| − | |||
Our team has delegated the workload equally amongst all our team members for all aspects of the project. Below is our project schedule that will be updated weekly according to the team's progress. | Our team has delegated the workload equally amongst all our team members for all aspects of the project. Below is our project schedule that will be updated weekly according to the team's progress. | ||
| Line 354: | Line 383: | ||
| − | '''Phase 3 (Week | + | '''Phase 3 (Week 11 to Week 14)''' |
[[File:P3GanttChart2.png|1010px]] | [[File:P3GanttChart2.png|1010px]] | ||
Latest revision as of 23:29, 23 November 2019
Project Motivation
The increasing use of big data has created new means and tools for businesses to make more informed choices and decisions. Businesses should maximize their use of these analytical tools to help them bridge the gap between data and decision-making, so that they can maintain a competitive edge and stay relevant in the market. However, not all business have the resources, capability or expertise to do so.
Our team decided to engage in this project as we are interested to help businesses connect the data that they have already collected and is readily available to their business operations and decision-making process. Our team hopes to make use of the geospatial analysis techniques and skills taught in class to assist our client in analyzing their data and propose meaningful business recommendations to them.
Our team is interested to compare the differences between (1) using radius of 2.5km, 3km and 3.5km from the store to determine operating areas, and (2) using drive time from store to determine operating areas. We would also like to identify and uncover any hidden relationships that might be affecting each stores' overall profitability. We hope that through this project, our team is able to not only learn invaluable skills that are related to geospatial analytics, but is able to also learn more about working for a real life project with business clients.
The team consists of Brendan Ong Sin Kai, Chong Yun Yu and Heng Bing Chow, three students from the Associate Professor of Information Systems (Practice), Dr. Kam Tin Seong's Geographic Information Systems for Urban Planning class in the School of Information Systems at Singapore Management University in Academic Year 2019-20 Semester 1.
Project Objectives
The project aims to meet the following objectives:
- Create digitized maps on Geographic Information System (GIS) software that corresponds to the location maps provided by our client
- Conduct detailed analysis for each store’s business profile based on the points of interests (POIs) within their trading zones and sub-zones
- Provide business recommendations to our client regarding the optimal trade area boundaries to have for each store, by comparing their current service areas with 2.5km, 3km and 3.5km radius service areas, as well as service areas determined by drive time
- Identify potential hot spots for our client to consider setting up stores in
Our team aims to produce the following deliverables by the end of our project:
- Geopackage file that contains digitized map layers for further analysis on our client’s end
- Data dictionary to guide our client through our analysis process
- Interactive web maps to showcase our business profiling results
- Project poster that encapsulates our crucial findings, which includes analysis results and strategic recommendations to our client
- Town hall poster presentation to share our analysis process and results with the public, while maintaining confidentiality of our client
- Project report detailing the entire project process, results, insights and recommendations
We hope that through this process, our team is able to learn more about the techniques of using GIS software for geographical analysis, and integrate what we learnt in this module together with what we learnt in other modules, such as coding, statistics and analytics. We also hope that we can provide our client basic analysis results that could kick-start new projects related to geographical analysis that could further their businesses.
Our team will be evaluating the success of our project with the following criterias:
- Schedule - the project must follow the schedule as shown in the last section of this proposal, and must be completed and submitted by 24 November 2019
- Quality of deliverables - deliverables produced must be clear, concise and insightful
- Stakeholder satisfaction - the results of our project should meet all objectives as stated
Project Scope
Our client for this project is a Food & Beverage (F&B) giant that operates in multiple countries worldwide. For this project, our team will be focusing on 11 branches in Taiwan, specifically all the branches of the F&B chain that are located along the East Coast of Taiwan. These branches are located in 4 different counties, namely Keelung, Nantou, Hualien and Taitung.
Since our allocated stores are scattered from the North to the South of the East side of Taiwan, we would like to identify any correlations between the location of the stores and the stores' reachability and profitability, based on the sales numbers and revenue for each trading zone, and the location of different POIs located within their respective trade areas that were provided by our client. We would also like to check if distance of the POIs from the store would directly impact the profitability of the stores as well. Furthermore, we aim to provide business recommendations to our client and identify potential hot-spots based on the results of our analysis.
The stores that were assigned to our team are HN, HZ, Jenyi (JI), Ji An (JA), Keelung Shensi (KG), Nantou Nangang (NN), Nantou Puli (PL), TD, Tsao-Tung (TT), UL, ZU (Jhushan Township). Amongst the stores that were allocated to our team, we had a mix of stores that were currently in operation, as well as stores that has ceased operation. Only two stores, Jenyi (JI) and Tsao-Tung (TT), are currently not in operation anymore.
The breakdown of stores according to their counties is as the following:
- Keelung: Keelung Shensi (KG), Jenyi (JI)
- Nantou: Nantou Nangang (NN), Nantou Puli (PL), Tsao-Tung (TT), ZU (Jhushan Township)
- Hualien: HN, HZ, Ji An (JA), UL
- Taitung: TD
.jpg)
Data Source: Taiwan_stores.gpkg from Dr. Kam and County MOI from our client
Data
| Data Filename | Description | Data Format | Source | Usage |
|---|---|---|---|---|
| GeoPackage | ||||
| Taiwan_stores | Contains data of store assignment from Professor Kam | GPKG | Dr. Kam | Allocation of Stores |
| Administrative Boundaries | ||||
| County MOI | Shows Counties in Taiwan | SHP | Client | Reference Layer |
| Town MOI | Shows Towns in Taiwan | SHP | Client | Reference Layer |
| Village MOI | Shows Villages in Taiwan | SHP | Client | Reference Layer |
| Location Maps | ||||
| HN-20181106寬30高30(木) | Contain service area of store | PPTX | Client | Reference Layer for Digitising |
| HZ-20181106寬75高75(木) | Contain service area of store | PPTX | Client | Reference Layer for Digitising |
| JA-20180309寬81高92(木)含框 | Contain service area of store | PPTX | Client | Reference Layer for Digitising |
| JI-20190102寬72高100(鋁)含框 | Contain service area of store | PPTX | Client | Reference Layer for Digitising |
| KG-20171116寬70高60(鋁) | Contain service area of store | PPTX | Client | Reference Layer for Digitising |
| NN-20171213寬77高87(木) | Contain service area of store | PPTX | Client | Reference Layer for Digitising |
| PL-20171213寬110高90(木)含框 | Contain service area of store | PPTX | Client | Reference Layer for Digitising |
| TD-20190903(原外送地圖底圖裁剪) | Contain service area of store | PPTX | Client | Reference Layer for Digitising |
| TT-20190614寬80高100(鋁) | Contain service area of store | PPTX | Client | Reference Layer for Digitising |
| UL-20181106寬40高80(木)含框 | Contain service area of store | PPTX | Client | Reference Layer for Digitising |
| ZU-20171213寬100高100(細木框) | Contain service area of store | PPTX | Client | Reference Layer for Digitising |
| Map Release | ||||
| Map Releases - Taiwan (TWN) v181G0 Release Notes | Contains Taiwan map release notes | Client | Reference Material for Analysis | |
| Points of Interest (POI) - North (V7AM181F0WV7000AACV0) | ||||
| Business | Shows businesses in North Taiwan | SHP | Client | Reference Layer for Analysis |
| CommSvc | Shows community service facilities in North Taiwan | SHP | Client | Reference Layer for Analysis |
| EduInsts | Shows education institutions in North Taiwan | SHP | Client | Reference Layer for Analysis |
| Entertn | Shows entertainment facilities in North Taiwan | SHP | Client | Reference Layer for Analysis |
| FinInsts | Shows financial institutions in North Taiwan | SHP | Client | Reference Layer for Analysis |
| Hospital | Shows medical facilities in North Taiwan | SHP | Client | Reference Layer for Analysis |
| MiscCategories | Shows miscellaneous amenities in North Taiwan | SHP | Client | Reference Layer for Analysis |
| ParkRec | Shows parks and recreational areas in North Taiwan | SHP | Client | Reference Layer for Analysis |
| Restrnts | Shows restaurants in North Taiwan | SHP | Client | Reference Layer for Analysis |
| Shopping | Shows shopping malls in North Taiwan | SHP | Client | Reference Layer for Analysis |
| TransHub | Shows transport hubs in North Taiwan | SHP | Client | Reference Layer for Analysis |
| TravDest | Shows travel destinations, such as hotels in North Taiwan | SHP | Client | Reference Layer for Analysis |
| Points of Interest (POI) - Central (V8AM181F0WV8000AACV0) | ||||
| Business | Shows businesses in Central Taiwan | SHP | Client | Reference Layer for Analysis |
| CommSvc | Shows community service facilities in Central Taiwan | SHP | Client | Reference Layer for Analysis |
| EduInsts | Shows education institutions in Central Taiwan | SHP | Client | Reference Layer for Analysis |
| Entertn | Shows entertainment facilities in Central Taiwan | SHP | Client | Reference Layer for Analysis |
| FinInsts | Shows financial institutions in Central Taiwan | SHP | Client | Reference Layer for Analysis |
| Hospital | Shows medical facilities in Central Taiwan | SHP | Client | Reference Layer for Analysis |
| MiscCategories | Shows miscellaneous amenities in Central Taiwan | SHP | Client | Reference Layer for Analysis |
| ParkRec | Shows parks and recreational areas in Central Taiwan | SHP | Client | Reference Layer for Analysis |
| Restrnts | Shows restaurants in Central Taiwan | SHP | Client | Reference Layer for Analysis |
| Shopping | Shows shopping malls in Central Taiwan | SHP | Client | Reference Layer for Analysis |
| TransHub | Shows transport hubs in Central Taiwan | SHP | Client | Reference Layer for Analysis |
| TravDest | Shows travel destinations, such as hotels in Central Taiwan | SHP | Client | Reference Layer for Analysis |
| Points of Interest (POI) - South (V9AM181F0WV9000AACV0) | ||||
| Business | Shows businesses in South Taiwan | SHP | Client | Reference Layer for Analysis |
| CommSvc | Shows community service facilities in South Taiwan | SHP | Client | Reference Layer for Analysis |
| EduInsts | Shows education institutions in South Taiwan | SHP | Client | Reference Layer for Analysis |
| Entertn | Shows entertainment facilities in South Taiwan | SHP | Client | Reference Layer for Analysis |
| FinInsts | Shows financial institutions in South Taiwan | SHP | Client | Reference Layer for Analysis |
| Hospital | Shows medical facilities in South Taiwan | SHP | Client | Reference Layer for Analysis |
| MiscCategories | Shows miscellaneous amenities in South Taiwan | SHP | Client | Reference Layer for Analysis |
| ParkRec | Shows parks and recreational areas in South Taiwan | SHP | Client | Reference Layer for Analysis |
| Restrnts | Shows restaurants in South Taiwan | SHP | Client | Reference Layer for Analysis |
| Shopping | Shows shopping malls in South Taiwan | SHP | Client | Reference Layer for Analysis |
| TransHub | Shows transport hubs in South Taiwan | SHP | Client | Reference Layer for Analysis |
| TravDest | Shows travel destinations, such as hotels in South Taiwan | SHP | Client | Reference Layer for Analysis |
| Sales Data | ||||
| Store_sales_data | Shows Sales Revenue, Sales No., and Average Sales Revenue per Sales No. in Taiwan | CSV | Dr. Kam | Reference Layer for Analysis |
Project Schedule
Our team decided to take the following steps in order to meet the objectives that we set:
- 1.Define service areas for each store
- a. Digitize current service areas and sub-areas for each store according to location map provided by our client
- b. Delineate service areas for each store according to 2.5km, 3km and 3.5km radius from the stores
- c. Delineate service areas for each store according to drive time from the stores
- a. Digitize current service areas and sub-areas for each store according to location map provided by our client
- 2. Extract 32 relevant POIs, which include
- ATM 3578
- HIGHER EDUCATION 8200
- BANK 6000
- HOSPITAL 8060
- BAR OR PUB 9532
- HOTEL 7011
- BOOKSTORE 9995
- INDUSTRIAL ZONE 9991
- BOWLING CENTRE 7933
- MEDICAL SERVICE 9583
- BUS STATION 4170
- NIGHTLIFE 5813
- BUSINESS FACILITY 5000
- PERFORMING ARTS 7929
- CINEMA 7832
- PHARMACY 9565
- CLOTHING STORE 9537
- RESIDENTIAL AREA/BUILDING 9590
- COFFEE SHOP 9996
- RESTAURANT 5800
- COMMUTER RAIL STATION 4100
- SCHOOL 8211
- CONSUMER ELECTRONICS STORE 9987
- SHOPPING 6512
- CONVENIENCE STORE 9535
- SPECIALITY STORE 9567
- DEPARTMENT STORE 9545
- SPORTS CENTRE 7997
- GOVERNMENT OFFICE 9525
- SPORTS COMPLEX 7940
- GROCERY STORE 5400
- TRAIN STATION 4013
3. Clip POIs onto the three different types of defined service areas for each store
4. Perform analysis on all stores according to the different types of defined trading zones
- Tabulate number of each POI and calculate percentage of each POI relative to total number of POIs in the respective areas
- Perform correlation analysis on both the number of POIs in the trade areas and distance of POIs from the stores against the sales numbers and revenue
- Compare differences between the three different types of defined trading zones
- Conduct DBSCAN clustering analysis
5. Derive insights and consolidate project into organised data files, data dictionary, poster and report
Our team has delegated the workload equally amongst all our team members for all aspects of the project. Below is our project schedule that will be updated weekly according to the team's progress.
Phase 1 (Week 1 to Week 5)
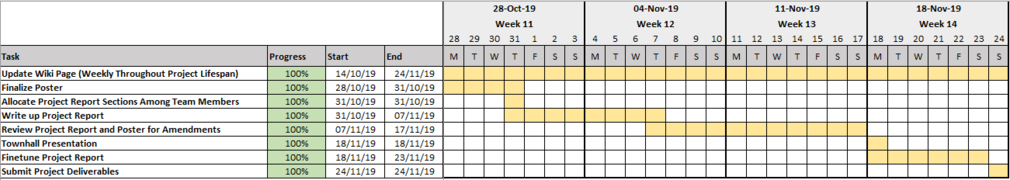
Phase 2 (Week 6 to Week 10)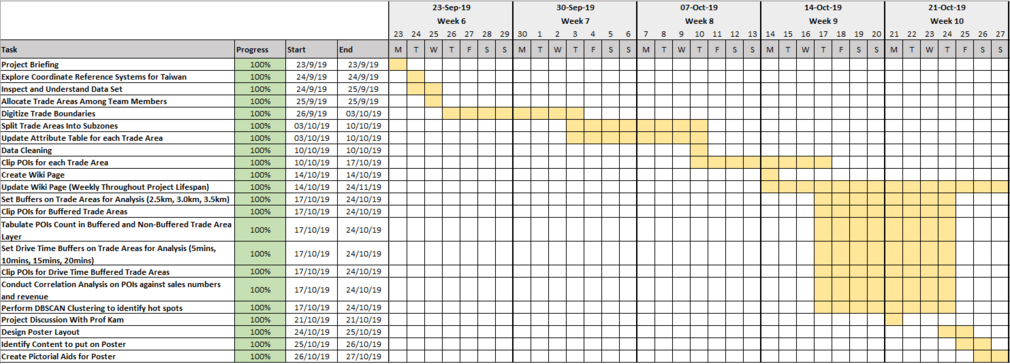
Phase 3 (Week 11 to Week 14)