Difference between revisions of "G2-Group04 Proposal"
| Line 4: | Line 4: | ||
{|style="background-color:#ffffff; color:#000000; padding: 10 0 10 0;" width="100%" cellspacing="0" cellpadding="0" valign="top" border="0" | | {|style="background-color:#ffffff; color:#000000; padding: 10 0 10 0;" width="100%" cellspacing="0" cellpadding="0" valign="top" border="0" | | ||
| style="padding:0.3em; font-size:100%; background-color:#ffffff; border-bottom:0px solid #000000; text-align:center; color:#ffffff" width="19%" | | | style="padding:0.3em; font-size:100%; background-color:#ffffff; border-bottom:0px solid #000000; text-align:center; color:#ffffff" width="19%" | | ||
| − | [[G2-Group04 Home|<font color="#000000" size=2><b>HOME</b></font>]] | + | [[G2-Group04 Home|<font color="#000000" size=2 font face = "Lato Black"><b>HOME</b></font>]] |
| style="border-bottom:0px solid #ffffff; background:none;" width="1%" | | | style="border-bottom:0px solid #ffffff; background:none;" width="1%" | | ||
| style="padding:0.3em; font-size:100%; background-color:#FBE46C; border-bottom:0px solid #000000; text-align:center; color:#000000" width="19%" | | | style="padding:0.3em; font-size:100%; background-color:#FBE46C; border-bottom:0px solid #000000; text-align:center; color:#000000" width="19%" | | ||
| − | [[G2-Group04 Proposal|<font color="#000000" size=2><b>PROPOSAL</b></font>]] | + | [[G2-Group04 Proposal|<font color="#000000" size=2 font face = "Lato Black"><b>PROPOSAL</b></font>]] |
| style="border-bottom:0px solid #ffffff; background:none;" width="1%" | | | style="border-bottom:0px solid #ffffff; background:none;" width="1%" | | ||
| style="padding:0.3em; font-size:100%; background-color:#ffffff; border-bottom:0px solid #000000; text-align:center; color:#000000" width="19%" | | | style="padding:0.3em; font-size:100%; background-color:#ffffff; border-bottom:0px solid #000000; text-align:center; color:#000000" width="19%" | | ||
| − | [[G2-Group04 Poster |<font color="#000000" size=2><b>POSTER</b></font>]] | + | [[G2-Group04 Poster |<font color="#000000" size=2 font face = "Lato Black"><b>POSTER</b></font>]] |
| style="border-bottom:0px solid #ffffff; background:none;" width="1%" | | | style="border-bottom:0px solid #ffffff; background:none;" width="1%" | | ||
| style="padding:0.3em; font-size:100%; background-color:#ffffff; border-bottom:0px solid #000000; text-align:center; color:#000000" width="19%" | | | style="padding:0.3em; font-size:100%; background-color:#ffffff; border-bottom:0px solid #000000; text-align:center; color:#000000" width="19%" | | ||
| − | [[G2-Group04 Web Maps |<font color="#000000" size=2><b>WEB MAPS</b></font>]] | + | [[G2-Group04 Web Maps |<font color="#000000" size=2 font face = "Lato Black"><b>WEB MAPS</b></font>]] |
|} | |} | ||
<!-- Header End --> | <!-- Header End --> | ||
| − | + | <br> | |
| − | == <font face="Lato Black"> | + | <!--PROJECT DESCRIPTION--> |
| + | {|style="background-color:#000000; color:#FBE46C;" width="100%" cellspacing="0" cellpadding="0" valign="top" border="0" | | ||
| + | | style="padding:0.3em; font-size:100%; background-color:#000000; border-bottom:0px solid #000000; border-top:0px solid #000000; text-align:center; color:#FBE46C" width="10%" | | ||
| + | <font color="#FBE46C" size=3 font face = "Lato Black"><b>PROJECT DESCRIPTION</b></font> | ||
| + | <!--/PROJECT DESCRIPTION--> | ||
| + | |} | ||
| + | <!--PROJECT DESCRIPTION TEXT--> | ||
<br> | <br> | ||
A Food and Nutrition Board (FNB) International Food Chain is interested in improving their current methods of delineation and analysis. | A Food and Nutrition Board (FNB) International Food Chain is interested in improving their current methods of delineation and analysis. | ||
| Line 29: | Line 35: | ||
<br> | <br> | ||
<br> | <br> | ||
| − | By doing so, we aim to optimise the performance of each store located in these trade areas and we hope to highlight the benefits of adopting the QGIS method so that the FNB business can make more informed business decisions in the future based on the insights they have gathered from QGIS. | + | By doing so, we aim to optimise the performance of each store located in these trade areas and we hope to highlight the benefits of adopting the QGIS method so that the FNB business can make more informed business decisions in the future based on the insights they have gathered from QGIS. |
<br> | <br> | ||
Revision as of 16:24, 21 November 2019
|
PROJECT DESCRIPTION |
A Food and Nutrition Board (FNB) International Food Chain is interested in improving their current methods of delineation and analysis.
Using the various functions available on QGIS, we are able to help the FNB business to conduct analysis on the correlation between various factors, such as the Point-Of-Interests (POIs) and Population Density, and the Sales Revenue of the 13 trade areas where this FNB business operates in. At the same time, we are able to advise the FNB business on how to delineate trade areas more efficiently and less tediously.
By doing so, we aim to optimise the performance of each store located in these trade areas and we hope to highlight the benefits of adopting the QGIS method so that the FNB business can make more informed business decisions in the future based on the insights they have gathered from QGIS.
Project Motivation
As the FNB business expands, it gets increasingly difficult to accurately keep track of the various factors that affects the business performance. Various factors such as the number of POIs and population density can affect the human traffic in each of the trade area and should be considered with utmost importance. Hence, using QGIS and SAS Enterprise Guide will be able to provide a much more precise analysis for the outlets in the trade areas.
Also, the current method that has been adopted by the FNB business to delineate the trade areas is Microsoft PowerPoint. This is a less effective approach as compared to using QGIS. Hence, we believe that by utilizing QGIS to digitize and delineate the different trade areas, the analysis process will be less tedious and less time-consuming as the data is being integrated into a single platform and allows for an easier integration for future usage.
This provides the FNB business with a more realistic & better representation of their stores’ environment through the analysis of the data provided by the food chain business and generated by QGIS and SAS Enterprise Guide. This will allow the business to make plans on how to optimise performance for its stores.
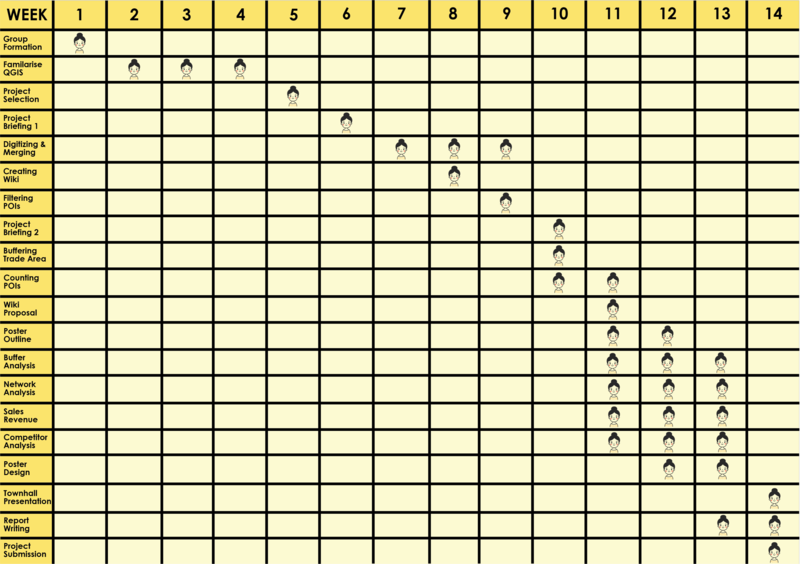
Project Timeline

