Difference between revisions of "Analysis"
| Line 52: | Line 52: | ||
** Methods Deployed in RPubs: [http://rpubs.com/jerrytohvan/548619 Punggol Forecast Population Analysis] | ** Methods Deployed in RPubs: [http://rpubs.com/jerrytohvan/548619 Punggol Forecast Population Analysis] | ||
** Methods Deployed in RPubs: [http://rpubs.com/jerrytohvan/548621 Punggol Peak Hour Travel Pattern Analysis] | ** Methods Deployed in RPubs: [http://rpubs.com/jerrytohvan/548621 Punggol Peak Hour Travel Pattern Analysis] | ||
| + | |||
| + | === Visualisations === | ||
| + | * Datatable view of forecast population per age group classification and subzones. | ||
| + | * Plotting time series line graph on each subzone’s population trend. | ||
| + | * Plotting the ARIMA forecasted population on each Subzone. | ||
=== Results === | === Results === | ||
| + | |||
| + | == Matilda’s Population Trend == | ||
| + | [[File:Matildas pop.jpg|center|400px]] | ||
| + | [[File:Matilda forecast.jpg|center|400px]] | ||
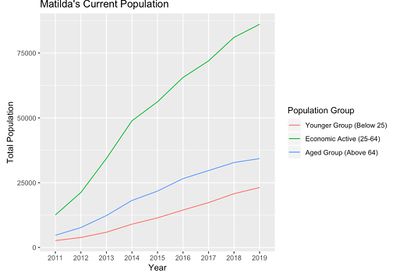
| + | First, the Matilda subzone is one of the most populated subzones in Punggol. The Matilda subzone has been populated ever since the initiation of HDB buildings in Punggol. The subzone is continuously growing ever since 2011 for all age groups. Interestingly the subzone is predominantly filled with the economic active group. Based on the 9 years trend, an ARIMA (0,1,0) with random walk were applied to predict the population for the next 5 years. We predict that there is a major growth in population for this subzone. We anticipate the there is a growing number of younger age group as the economic active age group might plan to start a family. | ||
Revision as of 23:55, 16 November 2019
Contents
Population Growth Trend & Forecast
In this population we will be using the Singstat’s `Singapore Residents by Planning AreaSubzone, Age Group, Sex and Type of Dwelling, June 2011-2019` data provided. There are few objectives that we want to understand from the population historical data:
- Understand the population trend for each subzone and age group classification (younger group, economic active group, and aged population) in order to facilitate basic necessities for each age group.
- Forecast the future population trend up to 2024 using the auto ARIMA model to re-evaluate the MP19.
- Interpreting the Arima model
- Similar application of ARIMA model in forecasting population trends:
- Zakria, Muhammad & Muhammad, Faqir. (2009). Forecasting the population of Pakistan using ARIMA models.. Agri. Sci. 46.
- Nyonyi, T and Mutongi, C. (2019). Prediction of total population in Togo using ARIMA models.
- Lin, Bin-Shan, et al. “Using ARIMA Models to Predict Prison Populations.” Journal of Quantitative Criminology, vol. 2, no. 3, 1986, pp. 251–264. JSTOR, www.jstor.org/stable/23365635.
- Make recommendations according to the population trend insights.
Data Cleaning Methods
- Data is cleaned to only show Punggol PA and its subzones.
- Age group were classified into a new group with the following requirement:
- Younger Population: 0-24
- Economic Active: 25-64
- Aged Population: 65 and above
- Summation group by was performed according to each subzone and age group classification.
- Reverse data frame vector was performed to swap rows and columns formatting as it is required to perform graph visualisation in R.
- Methods Deployed in RPubs: Punggol Forecast Population Analysis
- Methods Deployed in RPubs: Punggol Peak Hour Travel Pattern Analysis
Visualisations
- Datatable view of forecast population per age group classification and subzones.
- Plotting time series line graph on each subzone’s population trend.
- Plotting the ARIMA forecasted population on each Subzone.
Results
Matilda’s Population Trend
First, the Matilda subzone is one of the most populated subzones in Punggol. The Matilda subzone has been populated ever since the initiation of HDB buildings in Punggol. The subzone is continuously growing ever since 2011 for all age groups. Interestingly the subzone is predominantly filled with the economic active group. Based on the 9 years trend, an ARIMA (0,1,0) with random walk were applied to predict the population for the next 5 years. We predict that there is a major growth in population for this subzone. We anticipate the there is a growing number of younger age group as the economic active age group might plan to start a family.


