Difference between revisions of "Criterion Score s"
Jump to navigation
Jump to search
| Line 28: | Line 28: | ||
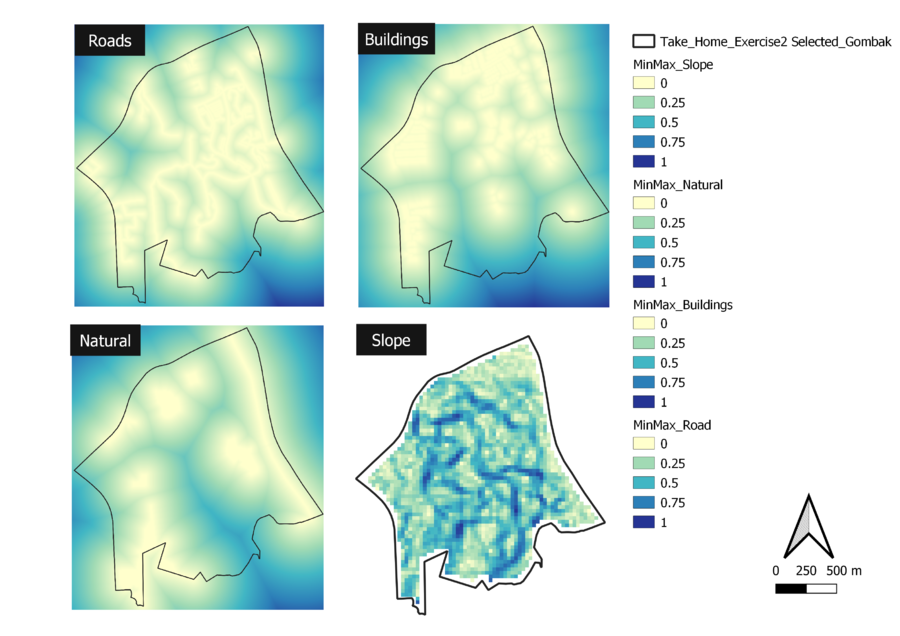
[[File:Criterion Score sl.png|900px|thumb|center|'''Gombak Study Area with Criterion Score Map of:<br>- Roads (Top Left)<br>- Buildings (Top Right)<br>- Natural Features (Bottom Left)<br>- Slope (Bottom Right)''']] | [[File:Criterion Score sl.png|900px|thumb|center|'''Gombak Study Area with Criterion Score Map of:<br>- Roads (Top Left)<br>- Buildings (Top Right)<br>- Natural Features (Bottom Left)<br>- Slope (Bottom Right)''']] | ||
| + | |||
| + | <br> | ||
| + | In order to ensure that the data across the four maps are standardized, the scale for the criterion score have been standardized for all. | ||
| + | <br> | ||
| + | 1.The min-max formula using the raster calculator to normalize the four proximity layers. | ||
| + | [[Image:Min-Max_sher.jpg|1000px|centre]] | ||
| + | <br> | ||
| + | 2. Symbology | ||
| + | The criterion score scale of 0 (Favorable pixel value) and 1 (Unfavorable pixel value) for all four maps. | ||
Revision as of 02:53, 12 November 2019
| Overview | Proximity |
In order to ensure that the data across the four maps are standardized, the scale for the criterion score have been standardized for all.
1.The min-max formula using the raster calculator to normalize the four proximity layers.
2. Symbology
The criterion score scale of 0 (Favorable pixel value) and 1 (Unfavorable pixel value) for all four maps.
