Difference between revisions of "SMT201 AY2019-20G1 EX2 Lin Xing"
Jump to navigation
Jump to search
| Line 1: | Line 1: | ||
| + | |||
== This page displays information for Take Home Exercise 1 == | == This page displays information for Take Home Exercise 1 == | ||
== Part One == | == Part One == | ||
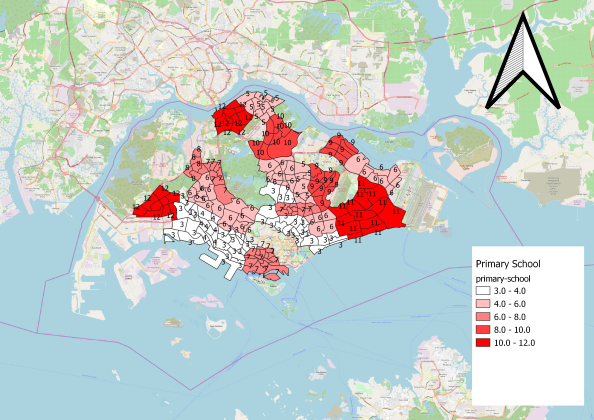
=== Primary School Allocation According to Subzones === | === Primary School Allocation According to Subzones === | ||
| − | [[File:Primary School1.png| | + | [[File:Primary School1.png|600px|center]] |
In order to have more information about Singapore School, three different layers were made. Apparently, the further from central of Singapore, the more numbers of primary school are allocated.<br> | In order to have more information about Singapore School, three different layers were made. Apparently, the further from central of Singapore, the more numbers of primary school are allocated.<br> | ||
| + | |||
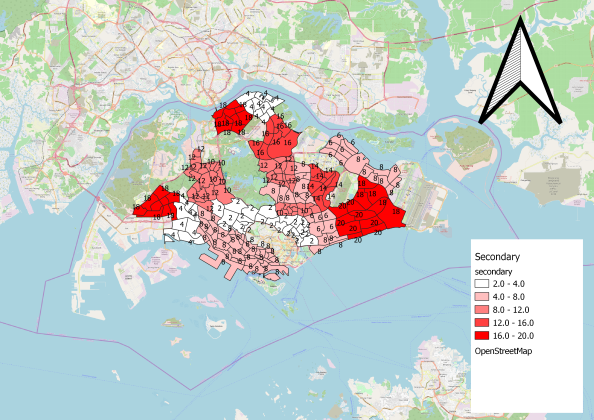
| + | === Secondary School Allocation According to Subzones === | ||
| + | [[File:Secondary1.png|600px|center]] | ||
| + | As you can notice from graph above, allocation of Secondary school is pretty much similar to Primary School. In certain extent, Singapore has put in a lot of efforts to make sure basic education is available for all kids. | ||
Revision as of 09:38, 15 September 2019
Contents
This page displays information for Take Home Exercise 1
Part One
Primary School Allocation According to Subzones

In order to have more information about Singapore School, three different layers were made. Apparently, the further from central of Singapore, the more numbers of primary school are allocated.
Secondary School Allocation According to Subzones

As you can notice from graph above, allocation of Secondary school is pretty much similar to Primary School. In certain extent, Singapore has put in a lot of efforts to make sure basic education is available for all kids.