Difference between revisions of "EX2 Lim Zhong Zhen Timothy"
| (9 intermediate revisions by the same user not shown) | |||
| Line 1: | Line 1: | ||
<!--MAIN HEADER --> | <!--MAIN HEADER --> | ||
{|style="background-color:#32CD32;" width="100%" cellspacing="0" cellpadding="0" valign="top" border="0" | | {|style="background-color:#32CD32;" width="100%" cellspacing="0" cellpadding="0" valign="top" border="0" | | ||
| − | | style="font-family:Century Gothic; font-size:100%; solid #000000; background:#32CD32; text-align:center;" width=" | + | | style="font-family:Century Gothic; font-size:100%; solid #000000; background:#32CD32; text-align:center;" width="50%" | |
; | ; | ||
[[SMT201_AY2018-19T1_EX2_Lim_Zhong_Zhen_Timothy| <font color="#FFFFFF"> About </font>]] | [[SMT201_AY2018-19T1_EX2_Lim_Zhong_Zhen_Timothy| <font color="#FFFFFF"> About </font>]] | ||
| − | | style="font-family:Century Gothic; font-size:100%; solid #1B338F; background:#00FF00; text-align:center;" width=" | + | | style="font-family:Century Gothic; font-size:100%; solid #1B338F; background:#00FF00; text-align:center;" width="50%" | |
; | ; | ||
[[EX2_Lim_Zhong_Zhen_Timothy| <font color="#FFFFFF"> Analysis </font>]] | [[EX2_Lim_Zhong_Zhen_Timothy| <font color="#FFFFFF"> Analysis </font>]] | ||
| style="font-family:Century Gothic; font-size:100%; solid #1B338F; background:#32CD32; text-align:center;" width="33%" | | | style="font-family:Century Gothic; font-size:100%; solid #1B338F; background:#32CD32; text-align:center;" width="33%" | | ||
| − | |||
| − | |||
| − | |||
|} | |} | ||
| + | |||
=Criterion Maps= | =Criterion Maps= | ||
{| class="wikitable" | {| class="wikitable" | ||
| Line 30: | Line 28: | ||
===Data preparation=== | ===Data preparation=== | ||
In order to do a ranked analysis, the layer data have to be normalised as the data now vary in scale. To that, '''Min-Max''' normalisation was used. <br> | In order to do a ranked analysis, the layer data have to be normalised as the data now vary in scale. To that, '''Min-Max''' normalisation was used. <br> | ||
| − | For example, To normalise road proximity, we take the (current_data - min_of given layer)/(max_of given layer - min_of given layer):" "Prox_road@1" - 0 / ( | + | For example, To normalise road proximity, we take the (current_data - min_of given layer)/(max_of given layer - min_of given layer):" "Prox_road@1" - 0 / (717.023" - 0) |
<br> | <br> | ||
Another thing to note, is that the results for roads and steepness needs to be inversed. As the closer the roads or less steep the land the '''better'''! | Another thing to note, is that the results for roads and steepness needs to be inversed. As the closer the roads or less steep the land the '''better'''! | ||
| Line 75: | Line 73: | ||
Using the AHP template given by prof Kam, I performed a PairWise Comparison matrix to calculate weightage comparison of each factor.<br> | Using the AHP template given by prof Kam, I performed a PairWise Comparison matrix to calculate weightage comparison of each factor.<br> | ||
| − | [[File:AHPmatrix1.PNG|frameless|center|description| | + | [[File:AHPmatrix1.PNG|frameless|center|description|500px|'''AHP template''']] |
<br> | <br> | ||
| − | [[File:AHPmatrix2.PNG|frameless|center|description| | + | [[File:AHPmatrix2.PNG|frameless|center|description|300px|'''AHP template''']] |
<br> | <br> | ||
The results show the weightage of each Factor, with 4.7% assigned to Economic, 36.6% to Accessibility, 47.9% to Health Risk and 10.9% to Natural Conservation | The results show the weightage of each Factor, with 4.7% assigned to Economic, 36.6% to Accessibility, 47.9% to Health Risk and 10.9% to Natural Conservation | ||
| Line 83: | Line 81: | ||
=Suitability Map= | =Suitability Map= | ||
===Data prepartion=== | ===Data prepartion=== | ||
| − | Using the data from the AHPmatrix, I created a ranked model for the suitability of the land for CDQC. | + | Using the data from the AHPmatrix, I created a ranked model for the suitability of the land for CDQC. |
| + | <br> | ||
To do so, I had to take the each factor multiplied by its percentage weightage. | To do so, I had to take the each factor multiplied by its percentage weightage. | ||
| + | Using raster calculator to calculate the land suitability layer: <br> | ||
| + | Expression: | ||
| + | ("RoadCriterion@1"*36.6%) + ("BuildingCriterion@1"*47.9%) + ("NaturalsCriterion@1"*10.9%) + ("SlopeCriterion@1"*4.7%) | ||
| + | <br> | ||
| + | [[File:suitabilityTIM.jpeg|frameless|center|description|900px|'''Suitability map''']] <br> | ||
| + | |||
| + | After combining all the various factors. A small part of Gombak is found suitable for the land. (Rainbow coloured) <br> | ||
| + | On further analysis, this area is found to be around 40,000m<sup>2</sup><br> | ||
| + | This is more than the required 10,000m<sup>2</sup>. | ||
| + | Although marked suitable, a key thing to note is that this area is high in steepness. This can be seen from the change in elevation, ranging from below '''60m to above 120m.''' | ||
| + | |||
| + | ===Reflection:=== | ||
| + | Thinking back, maybe i should not have given such a large deviation in weightage(importance) for the factors as there were only 4 factors. This might have skewed the data too much. Almost making Economic factor(steepness) barely noticeable. | ||
<!--MAIN HEADER --> | <!--MAIN HEADER --> | ||
{|style="background-color:#32CD32;" width="100%" cellspacing="0" cellpadding="0" valign="top" border="0" | | {|style="background-color:#32CD32;" width="100%" cellspacing="0" cellpadding="0" valign="top" border="0" | | ||
| − | | style="font-family:Century Gothic; font-size:100%; solid #000000; background:#32CD32; text-align:center;" width=" | + | | style="font-family:Century Gothic; font-size:100%; solid #000000; background:#32CD32; text-align:center;" width="50%" | |
; | ; | ||
[[SMT201_AY2018-19T1_EX2_Lim_Zhong_Zhen_Timothy| <font color="#FFFFFF"> About </font>]] | [[SMT201_AY2018-19T1_EX2_Lim_Zhong_Zhen_Timothy| <font color="#FFFFFF"> About </font>]] | ||
| − | | style="font-family:Century Gothic; font-size:100%; solid #1B338F; background:#00FF00; text-align:center;" width=" | + | | style="font-family:Century Gothic; font-size:100%; solid #1B338F; background:#00FF00; text-align:center;" width="50%" | |
; | ; | ||
[[EX2_Lim_Zhong_Zhen_Timothy| <font color="#FFFFFF"> Analysis </font>]] | [[EX2_Lim_Zhong_Zhen_Timothy| <font color="#FFFFFF"> Analysis </font>]] | ||
| style="font-family:Century Gothic; font-size:100%; solid #1B338F; background:#32CD32; text-align:center;" width="33%" | | | style="font-family:Century Gothic; font-size:100%; solid #1B338F; background:#32CD32; text-align:center;" width="33%" | | ||
| − | |||
| − | |||
| − | |||
|} | |} | ||
Latest revision as of 01:05, 11 November 2019
|
|
|
Contents
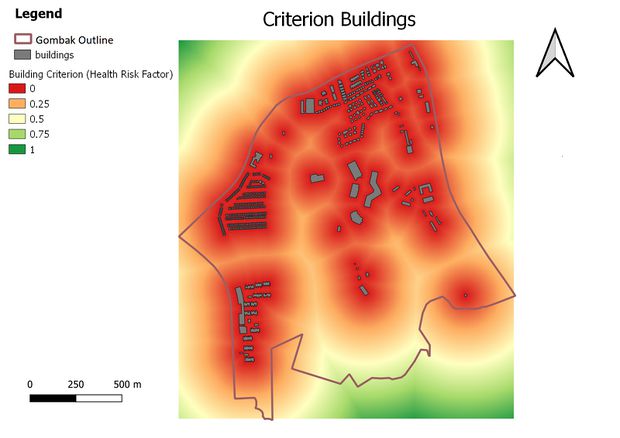
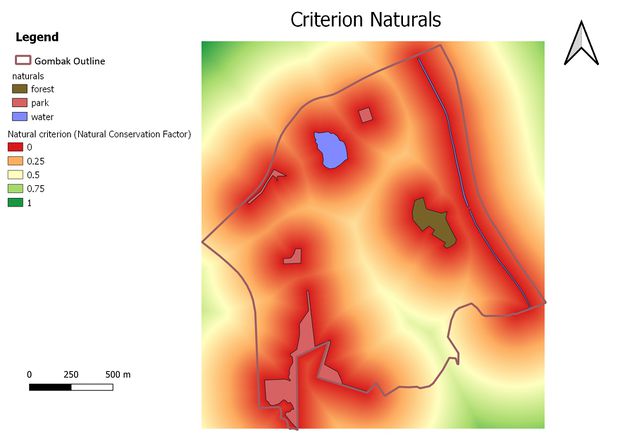
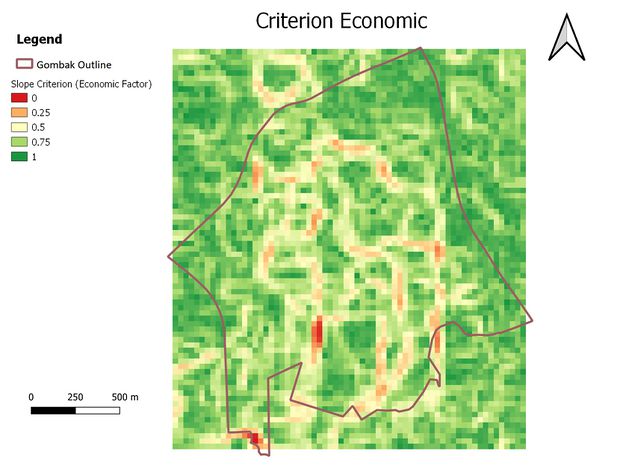
Criterion Maps
Data preparation
In order to do a ranked analysis, the layer data have to be normalised as the data now vary in scale. To that, Min-Max normalisation was used.
For example, To normalise road proximity, we take the (current_data - min_of given layer)/(max_of given layer - min_of given layer):" "Prox_road@1" - 0 / (717.023" - 0)
Another thing to note, is that the results for roads and steepness needs to be inversed. As the closer the roads or less steep the land the better!
Thus, I took (1 - normalised data) to get the correct comparison.
Next step
| Factor | Priority | Reason | AHP Scoring
|
| Health Risk | 1 | CDQC's top priority is to keep the diseased away from the general population, this is prevent the virus from spreading and causing an epidemic. Thus, this factor is highest
priority |
9 |
| Accessibility | 2 | Transportation is the key issue in swiftly getting the patient away from the masses. Thus, accessibility is also given a very high priority. | 7 |
| Natural Conservation | 3 | Although important, Parks and water beds and forests is not as populated as the buildings. | 3 |
| Economic | 4 | Singapore has limited land space, and do not have a lot of non-steep land. Thus, I believe it is worth investing on a place which poses less health risk, has good transportation and further away from natural conservation. | 1 |
Using the AHP template given by prof Kam, I performed a PairWise Comparison matrix to calculate weightage comparison of each factor.
The results show the weightage of each Factor, with 4.7% assigned to Economic, 36.6% to Accessibility, 47.9% to Health Risk and 10.9% to Natural Conservation
Suitability Map
Data prepartion
Using the data from the AHPmatrix, I created a ranked model for the suitability of the land for CDQC.
To do so, I had to take the each factor multiplied by its percentage weightage.
Using raster calculator to calculate the land suitability layer:
Expression:
("RoadCriterion@1"*36.6%) + ("BuildingCriterion@1"*47.9%) + ("NaturalsCriterion@1"*10.9%) + ("SlopeCriterion@1"*4.7%)
After combining all the various factors. A small part of Gombak is found suitable for the land. (Rainbow coloured)
On further analysis, this area is found to be around 40,000m2
This is more than the required 10,000m2.
Although marked suitable, a key thing to note is that this area is high in steepness. This can be seen from the change in elevation, ranging from below 60m to above 120m.
Reflection:
Thinking back, maybe i should not have given such a large deviation in weightage(importance) for the factors as there were only 4 factors. This might have skewed the data too much. Almost making Economic factor(steepness) barely noticeable.
|
|
|


