Difference between revisions of "SMT201 AY2019-20G2 Ex2 Ng Qi Hui"
(Created page with "== Gombak Study Area and Target Features == border|center|800x800px| <br> source: data.gov.sg, BBBike@Singapore, EarthData Search <br>...") |
|||
| (6 intermediate revisions by the same user not shown) | |||
| Line 3: | Line 3: | ||
[[File:Study_Areas_With_Targets.png |border|center|800x800px|]] | [[File:Study_Areas_With_Targets.png |border|center|800x800px|]] | ||
<br> | <br> | ||
| − | + | sources: data.gov.sg, BBBike@Singapore, EarthData Search | |
<br> | <br> | ||
=== Roads === | === Roads === | ||
| Line 30: | Line 30: | ||
[[File:Proximity.PNG |border|center|800x800px|]] | [[File:Proximity.PNG |border|center|800x800px|]] | ||
<br> | <br> | ||
| − | + | sources: data.gov.sg, BBBike@Singapore, EarthData Search | |
<br> | <br> | ||
| Line 54: | Line 54: | ||
[[File:Criterion_Score.PNG |border|center|800x800px|]] | [[File:Criterion_Score.PNG |border|center|800x800px|]] | ||
| − | + | <br> | |
| + | sources: data.gov.sg, BBBike@Singapore, EarthData Search | ||
| + | <br> | ||
<br> | <br> | ||
To get the criterion score for each raster, I made use of the Min-Max Standardization technique to standardize everything so that the resulting values will be from 0 to 1, allowing for easy comparisons. I then made use of the ‘Singleband pseudocolour’ under the Symbology function to categorize my rasters. I made use of the ‘Spectral’ color ramp for a better visualization of the proximity of the areas to the relative features. | To get the criterion score for each raster, I made use of the Min-Max Standardization technique to standardize everything so that the resulting values will be from 0 to 1, allowing for easy comparisons. I then made use of the ‘Singleband pseudocolour’ under the Symbology function to categorize my rasters. I made use of the ‘Spectral’ color ramp for a better visualization of the proximity of the areas to the relative features. | ||
| Line 89: | Line 91: | ||
<br> | <br> | ||
| − | From the results derived via the Analytic Hierarchy Process (AHP) matrix, Health Risk is the considered to be the most important factor with a value of 0.55, followed by Natural Conservation with a value of 0.250, Accessibility with a value of 0.150, and lastly Economic with a value of 0.049. I considered Health Risk to have a higher relative importance as compared to the others due of the nature of the centre, which is a place to quarantine those who have communicable diseases. As this project is to be undertaken by the government | + | From the results derived via the Analytic Hierarchy Process (AHP) matrix, Health Risk is the considered to be the most important factor with a value of 0.55, followed by Natural Conservation with a value of 0.250, Accessibility with a value of 0.150, and lastly Economic with a value of 0.049. I considered Health Risk to have a higher relative importance as compared to the others due of the nature of the centre, which is a place to quarantine those who have communicable diseases. The impacts of the diseases spreading due to interactions of the patients with the outside people will cause even more panic and harm to the country. As this project is to be undertaken by the government given the context that the centre is going to be for the nation's population, I decided to consider the Economic factor to be of the least importance since a government has reserves that they can dip into to facilitate the construction of the quarantine centre. Between choosing the relative importance of the Natural Conservation to Accessibility, both were similar, but I felt that Natural Conservation is more importance as this factor is for the long term, while the Accessibility factor is only for the short term convenience of building up the centre. Therefore, the score i gave for the relative importance of the Accessibiliy factor as compared to the Natural Conservation factor was only 1/2. |
<br> | <br> | ||
| Line 110: | Line 112: | ||
<br> | <br> | ||
| − | The suitable land area raster map is generated through a calculation | + | The suitable land area raster map is generated through a calculation of the criterion scores for each of the layers * the relative weightage of each of the layers as derived through the AHP, by using the Raster Calculator function, and then summing all the values up. [Formula: "Standardised_Buildings@1"*0.55 + "Standardised_Natural_Features@1" * 0.25 + (1 - "Standardised_Roads@1") * 0.15 + (1 - "Standardised_Slope@1") * 0.049] After obtaining the suitability raster map for Gombak and clipping it to the Overlay Layer of Gombak Study Area, I made use of the ‘Polygonise’ function under the Extraction tool to derive the polygons. From there, I created a column in the attribute table named 'Area' and with the value of '$area', which is the area of each respective polygon. I then used the 'Categorise' function under the Symbology to categorise the 2 polygons based on the column 'DN', which had values 0 and 1. The area in red shows the area that has one of the highest overall scoring, and has a DN value = 1. |
<br> | <br> | ||
| Line 117: | Line 119: | ||
<br> | <br> | ||
source: data.gov.sg, BBBike@Singapore, EarthData Search | source: data.gov.sg, BBBike@Singapore, EarthData Search | ||
| + | <br> | ||
| + | [[File:Suitable_Lot_1.PNG |border|center|800x800px|]] | ||
| + | <br> | ||
| + | Land data for Purple-Colored Land Lot | ||
| + | <br> | ||
| + | [[File:Suitable_Lot_2.PNG |border|center|800x800px|]] | ||
| + | <br> | ||
| + | Land data for Blue-Colored Land Lot | ||
<br> | <br> | ||
| + | I decided to split the red area into the blue-colored land lot and purple-colored land lot respectively through the use of the digitization tool. After inputting their DN values and recalculating the areas, the blue-colored land lot is found to have an area of 12,452m2, while the purple-colored land lot has an area of 49,849m2. Both of these land lots have a contiguous area of at least 10,000m2 which fulfills the task description requirements. The decision to split the red polygon into the 2 sub-polygon land lots was made as the thin connecting area between these 2 land lots have a very small area which is not a very suitable area to build the centre. | ||
| − | + | As the suggested land lots are only taking into account the some of the features available in Gombak, a more comprehensive analysis should be done with other points of interests and for areas that lie outside Gombak but are in close proximity to the suggested land lot. | |
| − | |||
| − | As the suggested land lots are only taking into account the some of the features available in Gombak, a more comprehensive analysis should be done with other points of interests and for areas that lie outside Gombak but are in close proximity to the land lot. | ||
Latest revision as of 00:33, 11 November 2019
Contents
Gombak Study Area and Target Features
sources: data.gov.sg, BBBike@Singapore, EarthData Search
Roads
I used the clipping tool to clip out the roads that fall in the Gombak study area. Selection by location was not used as that method will select the entire road, resulting in inaccurate data as some parts of the road do not lie inside Gombak.
The task description specifically stated that the selected site should be close to 2 existing local roads – namely service roads and tracks. I selected both the ‘Service’ and ‘Track’ under the type category from the attribute table to filter out and export the required roads. The ‘Categorized’ function under Symbology was used to categorize the different types of roads, with service roads represented by the light blue lines, and the tracks represented by the light brown lines.
The accessibility factor of the selected site will depend on the extracted roads data. The roads are seen to be quite spread out, with more lines congregating at the top right area of Gombak.
Buildings
Employing the same method as above, I extracted out the relevant buildings that fall inside the Gombak study area. As the selected site should be away from population to prevent the spread of the disease, I decided not to categorize the buildings as all these buildings would have occupants at one time or another.
The health risk factor of the selected side will depend on the extracted buildings data. From the map view, majority of the buildings are located in the upper half layer of Gombak, with the bottom right of Gombak almost devoid of any buildings.
Natural Features
Similar to the method of extracting out the roads data, I made use of the clipping tool instead of the selection by location as that method will cause the natural areas will be selected completely, even those areas that do not fall in the Gombak area.
I used the ‘Categorized’ function under Symbology to categorize the different natural features into ‘Forest’ – dark green, ‘Park’ – light green, and ‘Water’ – blue. This is for easy visualization.
The natural conservation factor of the selected site will depend on the extracted natural features data. According to the map view, there are very little natural features present at the bottom right area in Gombak.
Elevation
After importing the digital elevation model (DEM) data, I made use of the ‘Clip raster by extent’ function under the ‘Extraction’ tool to extract out the digital elevation data relevant to the Gombak area. The economic factor of the selected site will depend on the DEM data extracted. From the map view, it can be seen that that there are very high slopes of up to 143m close to the central bottom part of Gombak. The lowest elevation in Gombak is 8m.
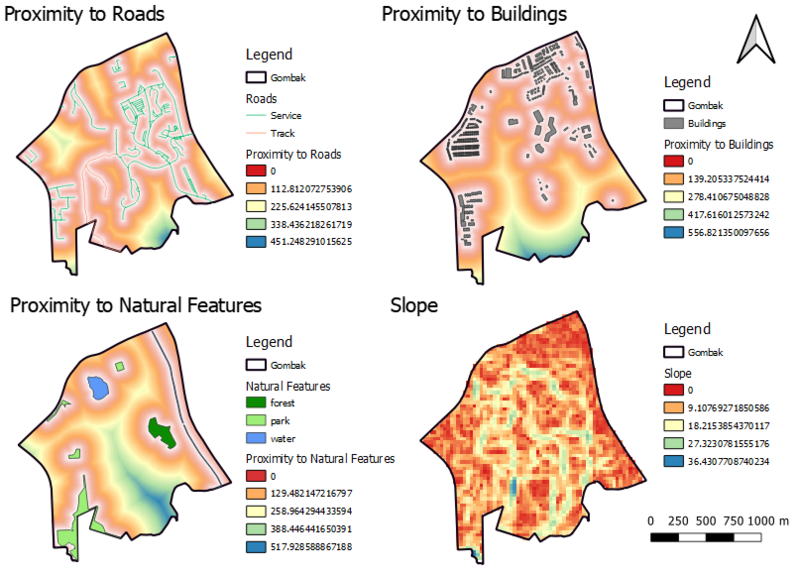
Gombak Study Area and Proximity to Target Features
sources: data.gov.sg, BBBike@Singapore, EarthData Search
To get the proximity of the layer, I had to first rasterize the extracted roads, buildings, and natural features layers relevant to Gombak from under the ‘Conversion’ function. But before that, I created a new field called ‘POI_CODE’ where it contained the value of ‘1’ for all the attributes. I chose my output extent to follow my DEM layer. After rasterizing and clipping out the required areas, I chose to use the ‘Singleband pseudocolour’ under the Symbology function to categorize my rasters. I made use of the ‘Spectral’ color ramp for a better visualization of the proximity of the areas to the relative features.
Roads
From the map view, the proximity to majority of the roads in Gombak is around 200m or less, as seen from the large areas of orange and yellow that corresponds to approximately 100m and 225m from the roads respectively. This implies that most of the areas in Gombak can be easily accessed to due to their close distance from the roads. However, there are also areas colored in green and blue, which implies that they are not in close proximity of the roads as they are about 300m-450m away. Such areas are not as accessible as compared to other areas.
Buildings
From the map view, the proximity to majority of the buildings in Gombak is around 300m or less, as seen from the large areas of orange and yellow that corresponds to approximately 150m and 300m respectively. These 2 colors lie mostly on the top half and bottom left of Gombak. This implies that many of the population is located in these areas. The bottom right area of Gombak is covered in green and blue, which implies that this area is not in close proximity to any buildings as the colors’ corresponding distances are approximately 400 and 500m respectively. Such areas are far away from the population.
Natural Features
From the map view, the proximity to majority of the natural features in Gombak is around 250m or less, as seen from the large areas of orange and yellow that corresponds to approximately 150m and 250m respectively. These colors are quite evenly spread out around the whole of Gombak, except for a small area located at bottom right area of Gombak that has green and blue color. This implies that only this area is not in close proximity to the natural features found in Gombak.
Slope
To generate the map view for slope, I made use of the ‘Slope’ function under the Raster Terrain Analysis function to compute out the slope raster from the DEM raster. Areas with the reddish spectrum colors have flatter surfaces, as compared to the blue spectrum colors that have steeper surfaces. The greatest steepness of an area is indicated in blue color with an approximate value of 36m, while the flattest areas are indicated by a red color with a value of 0m.
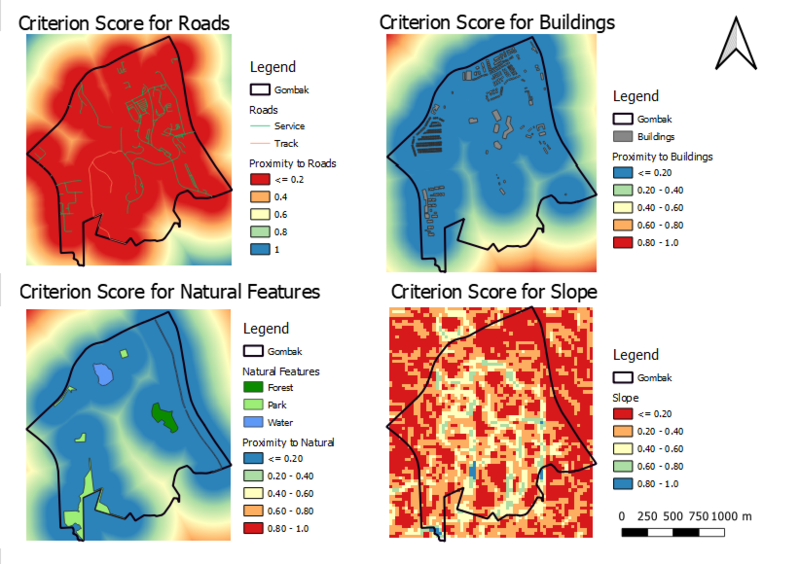
Gombak Study Area and Criterion Score for Target Features Factor Layers
sources: data.gov.sg, BBBike@Singapore, EarthData Search
To get the criterion score for each raster, I made use of the Min-Max Standardization technique to standardize everything so that the resulting values will be from 0 to 1, allowing for easy comparisons. I then made use of the ‘Singleband pseudocolour’ under the Symbology function to categorize my rasters. I made use of the ‘Spectral’ color ramp for a better visualization of the proximity of the areas to the relative features.
Roads
To calculate the roads criterion score, I had to do a (1 – Standarised results of Roads). This is because the lower values for the roads is considered to be better, since the selected site had to be in close proximity to the roads for easy accessibility. By deducting the standardized results, the criterion score for the areas nearer to the roads will be given a higher score. The red and orange areas shows that these areas are suitable for the centre to be built as they are close to the existing roads which allows for easy transportation of building materials during construction stage.
Buildings
For the buildings criterion score, I just used the Standardised results of the Buildings. This is because the area that have lower proximity to the buildings have a greater distance, which corresponds to higher scorings for these areas. Standardisation does not change these values. The yellow areas that fall in the Gombak area are suitable for the centre to be built as they are far away from the population, which helps to lower the health risk of the diseases spreading.
Natural Features
For the natural features criterion score, I just used the Standardized results of the natural features. Similar to the buildings, the areas that have lower proximity to these features have a greater distance, which corresponds to higher scorings for these areas. Standardisation will not change these values either. The yellow areas that can be seen from the map view shows the suitable areas for the centre to be built as they are away from forested land, park and water, thereby helping to sustain the natural conservation efforts.
Slopes
To calculate the slopes criterion score, I had to do a (1 – Standardised results of Slope). This is because having lower steepness of the slopes is preferred. By deducting the standardized values, the criterion scores for the areas with a lower steepness value will have a higher score. The areas in red and orange shows that these areas are suitable for the construction of the centre as they avoid steep slopes, which prevents the risk of having higher development costs as steep slopes would tend to involve a lot of cut-and-fills.
Analytical Hierarchical Process
The above scale is used during the pair-wise comparison matrix to determine the relative importance of one criteria in comparison to another.
From the results derived via the Analytic Hierarchy Process (AHP) matrix, Health Risk is the considered to be the most important factor with a value of 0.55, followed by Natural Conservation with a value of 0.250, Accessibility with a value of 0.150, and lastly Economic with a value of 0.049. I considered Health Risk to have a higher relative importance as compared to the others due of the nature of the centre, which is a place to quarantine those who have communicable diseases. The impacts of the diseases spreading due to interactions of the patients with the outside people will cause even more panic and harm to the country. As this project is to be undertaken by the government given the context that the centre is going to be for the nation's population, I decided to consider the Economic factor to be of the least importance since a government has reserves that they can dip into to facilitate the construction of the quarantine centre. Between choosing the relative importance of the Natural Conservation to Accessibility, both were similar, but I felt that Natural Conservation is more importance as this factor is for the long term, while the Accessibility factor is only for the short term convenience of building up the centre. Therefore, the score i gave for the relative importance of the Accessibiliy factor as compared to the Natural Conservation factor was only 1/2.
The consistency check is 5%, which is less than the standard value of 10%. This shows that our assessment is rational and consistent.
The AHP values derived will be used in the generation of the suitable land lots as weights for each of the roads, buildings, natural features and slope layers.
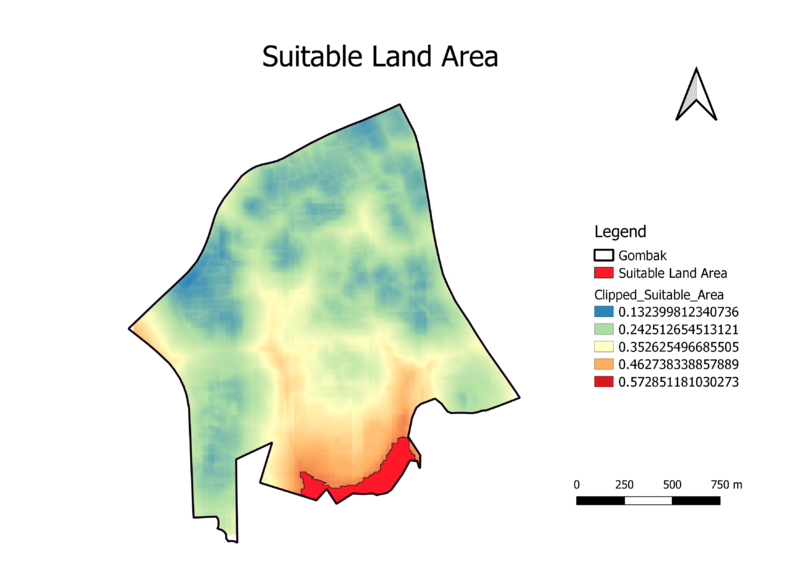
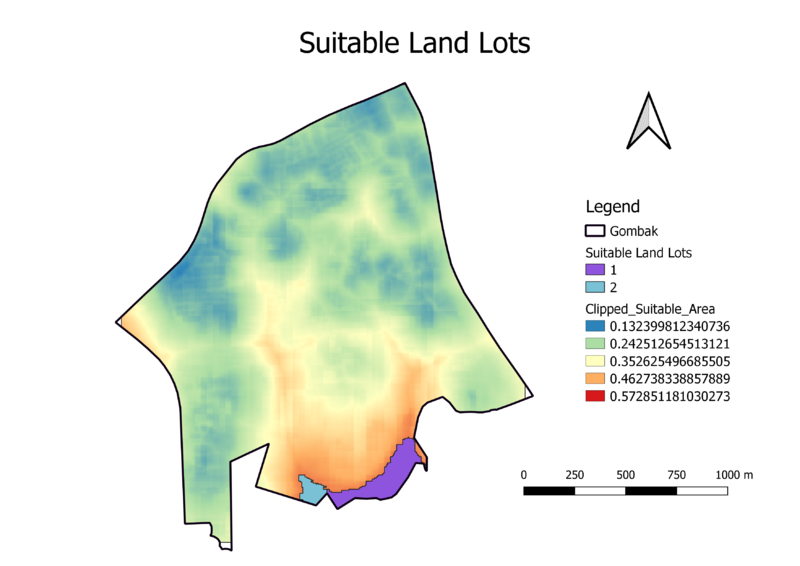
Suitable Land Lots available in Gombak
source: data.gov.sg, BBBike@Singapore, EarthData Search
The suitable land area raster map is generated through a calculation of the criterion scores for each of the layers * the relative weightage of each of the layers as derived through the AHP, by using the Raster Calculator function, and then summing all the values up. [Formula: "Standardised_Buildings@1"*0.55 + "Standardised_Natural_Features@1" * 0.25 + (1 - "Standardised_Roads@1") * 0.15 + (1 - "Standardised_Slope@1") * 0.049] After obtaining the suitability raster map for Gombak and clipping it to the Overlay Layer of Gombak Study Area, I made use of the ‘Polygonise’ function under the Extraction tool to derive the polygons. From there, I created a column in the attribute table named 'Area' and with the value of '$area', which is the area of each respective polygon. I then used the 'Categorise' function under the Symbology to categorise the 2 polygons based on the column 'DN', which had values 0 and 1. The area in red shows the area that has one of the highest overall scoring, and has a DN value = 1.
source: data.gov.sg, BBBike@Singapore, EarthData Search
Land data for Purple-Colored Land Lot
Land data for Blue-Colored Land Lot
I decided to split the red area into the blue-colored land lot and purple-colored land lot respectively through the use of the digitization tool. After inputting their DN values and recalculating the areas, the blue-colored land lot is found to have an area of 12,452m2, while the purple-colored land lot has an area of 49,849m2. Both of these land lots have a contiguous area of at least 10,000m2 which fulfills the task description requirements. The decision to split the red polygon into the 2 sub-polygon land lots was made as the thin connecting area between these 2 land lots have a very small area which is not a very suitable area to build the centre.
As the suggested land lots are only taking into account the some of the features available in Gombak, a more comprehensive analysis should be done with other points of interests and for areas that lie outside Gombak but are in close proximity to the suggested land lot.


