Difference between revisions of "SMT201 AY2019-20G1 EX2 Ng Xun Jie"
| Line 129: | Line 129: | ||
[[File:Vectorized land suitability final NXJ.jpeg|1100px|center]] | [[File:Vectorized land suitability final NXJ.jpeg|1100px|center]] | ||
| − | Final Map | + | [[ Final Map|1100px|center]] |
| + | |||
The final map shows the result after converting from a raster to a vector. I performed slicing to the polygon as shown in the final map. Both polygon's area was bigger than 10,000 sqm after splitting. After much consideration, I argue that the Suitable Lot with arrow pointing out, stating the area is 112375.542 sqm is the best plot among all the other suitable plots. This is because it fulfills the basic requirement for the centre building and it is relatively further from human settlement compared to its adjacent polygon, thus making it very compelling to be considered as the most suitable plot for development. | The final map shows the result after converting from a raster to a vector. I performed slicing to the polygon as shown in the final map. Both polygon's area was bigger than 10,000 sqm after splitting. After much consideration, I argue that the Suitable Lot with arrow pointing out, stating the area is 112375.542 sqm is the best plot among all the other suitable plots. This is because it fulfills the basic requirement for the centre building and it is relatively further from human settlement compared to its adjacent polygon, thus making it very compelling to be considered as the most suitable plot for development. | ||
Revision as of 23:45, 10 November 2019
Contents
Part 1: Map Views with Roads, Buildings, Natural Areas and Elevation
Accessibility Factor (Service roads and tracks)
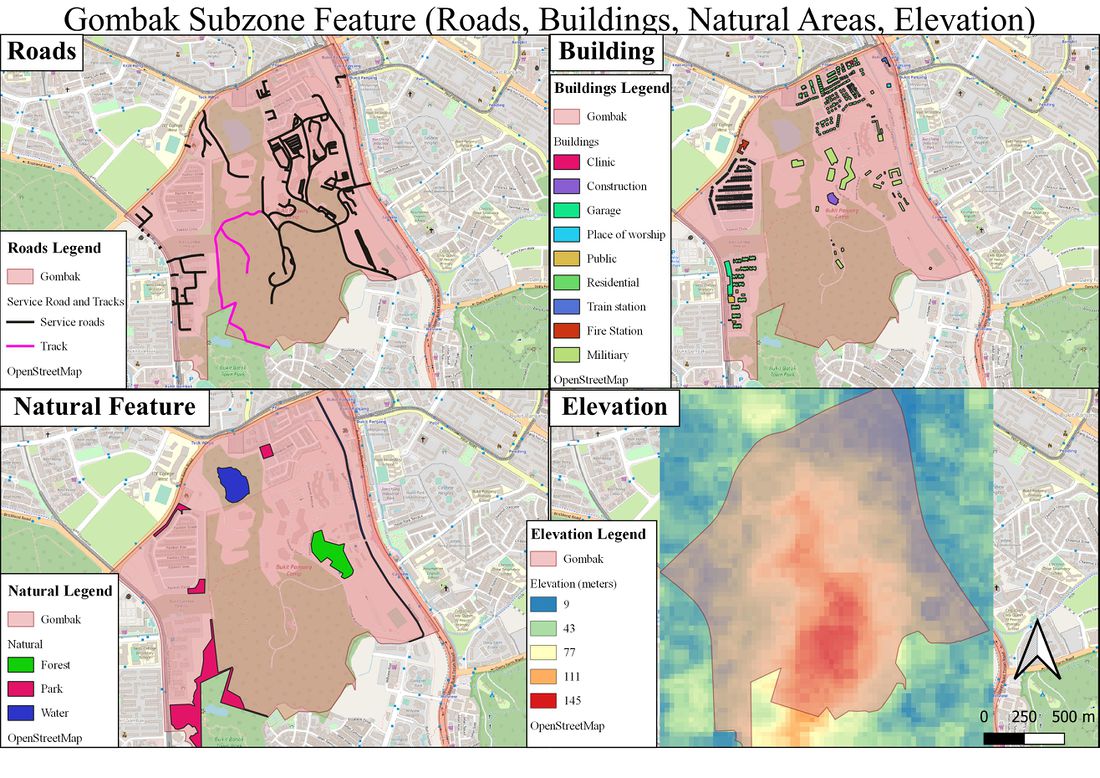
The selected site should be close to service roads and tracks to ensure easy transportation of building materials during the construction stage. Only 2 types of roads, namely service roads and tracks are shown as a line vector for this analysis. There are 199 service roads which are spread throughout the Gombak subzone area and there are only 2 tracks, primarily concentrated in the central-southwest region of Gombak subzone.
Health Risk Factor (Buildings)
The selected site should be away from population in order to prevent the spread of communicable disease to the nearby population. From the data retrieved from BBBike Singapore, 9 types of buildings have been identified, which consist of Clinic, Construction, Garage, Place of worship, Public, Residential, Train station, Fire station and military. There is a total of 527 buildings in Gombak, however, there are 505 buildings with unknown type. In order to illustrate the different type of buildings, Master Plan Land Use data and OpenStreetMap data are used to identified the type of the buildings and labelled accordingly. Conclusively, all buildings are considered in the preceding analysis.
Natural Conservation Factor (Natural Features)
The selected site should be built away from forested land, park and water which can be identified through the Natural data provided by BBbike Singapore. There are 1 forest, 4 parks and 3 water bodies in the dataset. The forest is illustrated with green, while the water body in blue and the park in pink respectively. Most of the parks are located at the outskirt of Gombak, and the 2 water bodies that runs adjacent to Bukit Panjang Link is less visible in the map compared to the single water body situated on the north of Gombak.
Economic Factor (Elevation)
The selected site should avoid being built on steep slope, in order to reduce higher development cost that comes with cut-and-fill operations involved in the construction at steep slope. The lowest point in Gombak is 9 meters above sea level shown in blue, while the highest point in Gombak which is 145 meters above sea level, situated at the southern region of Gombak is shown in red. Most of the settlements and infrastructure in Gombak subzone are built less than or equal to 77 meters above sea level.
Part 2: Proximity analysis: Raster Map Views with Roads, Buildings, Natural Features and Slope
Proximity to Roads
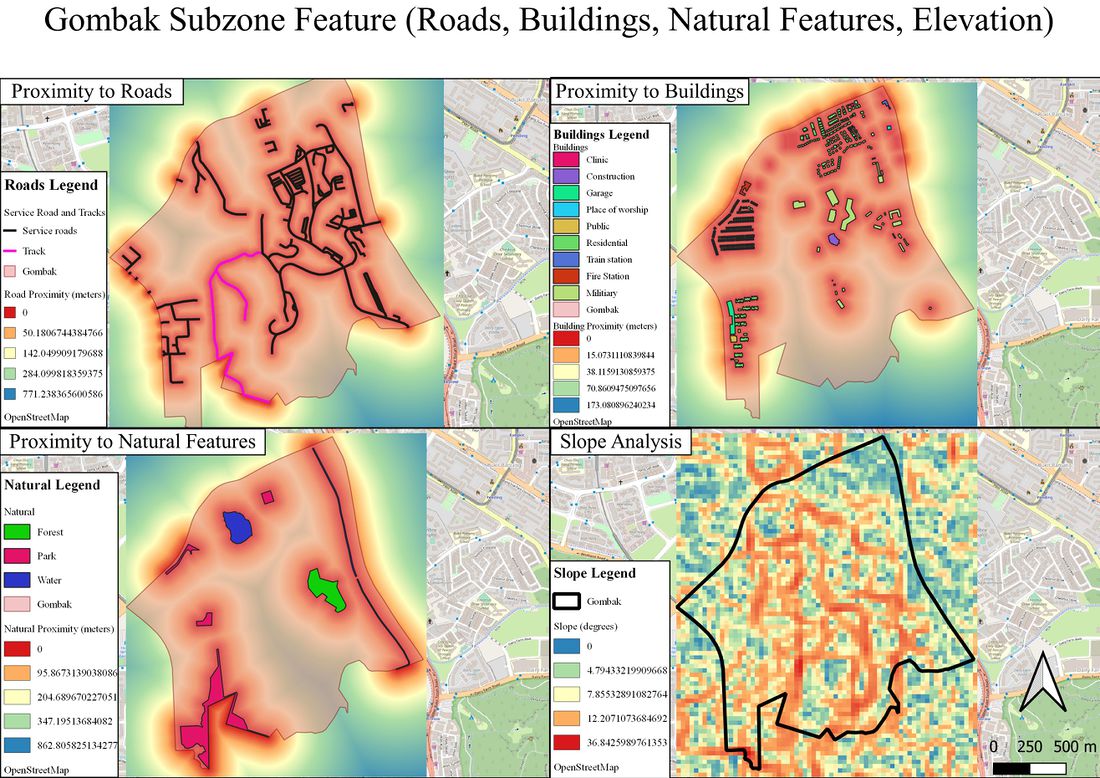
Proximity analysis is done on the Road Raster layer in order to determine the distance, in meters of a road from any potential sites for building. The range of colours give reference to pixels about their distance from the roads. The colour red signifies that the pixel is very close to a particular road, while the colour beige signifies being moderately close and blue signifies that the pixel is very far to a particular road.
Min = 0 meters Max = 772.01037597656 meters
Proximity to Buildings
Proximity analysis done on the building raster map assist in identification of sites which are furthest away from population settlement. This is because communicable disease must be quarantined to prevent an epidemic that may cause severe implication. Pixels that are closest to any building, measured in meters, is denoted the colour red and down the red colour spectrum till it reaches blue colour which signifies the pixel is furthest away from any building in Gombak area.
Min = 0 meters Max = 173.25415039063 meters
Proximity to Natural Features
Similar to the requirement for the selected site to be away from any population settlement, the selected site must be situated away from any natural features in order to conserve the natural resources in Gombak subzone. Any pixels that has at least the value 200 meters away from any natural areas in the Gombak area will be coloured beige and furthest being blue, while the pixels that are closer to any natural areas will be coloured orange and closest being coloured red.
Min = 0 meters Max = 863.66949462891 meters
Slope Analysis (degrees)
The slope degree of the Gombak area can be visualized through slope raster analysis of the Digital Elevation raster layer. According to the colour scheme in the legend, slope degree that is lesser than 7.5 degrees is denoted with yellow and slope degree approaching zero the colour blue, while the steeper the slope, the colour approaches red. Analysis from the map shows that most of Gombak subzone has very moderate slope degrees of around 7.8 degrees except for the Southern region that sees the highest slope degrees of 36.9.
Min = 0 Degrees Max = 36.87947845459 Degrees
PART 3: Criterion scores for the 4 decision factors
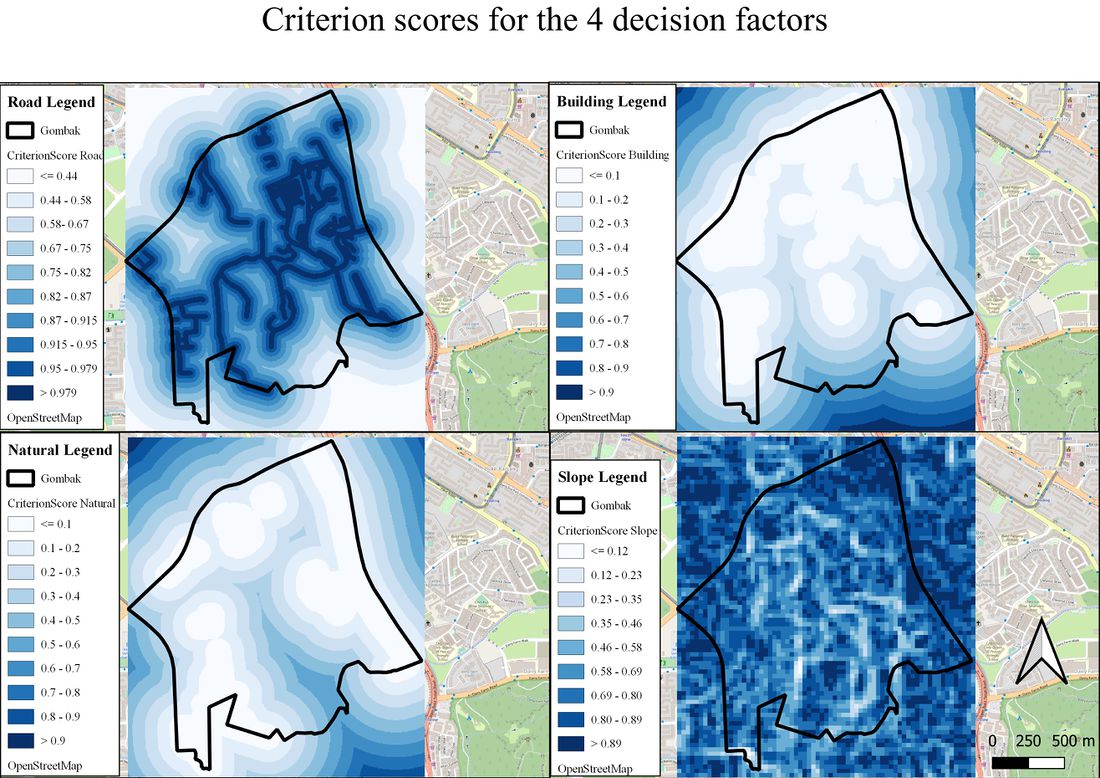
In order to determine the land suitability for the building of National Communicable Disease Quarantine Centre, the proximity analysis results above must be standardized and I employ the following formula to carry out standardization of each of the proximity layer that represents the 4 different decision factors:
MM(Xij) = standardized results
Xij = Proximity to features
Xmin = Minimum value of proximity to features
Xmax = Maximum value of proximity to features
However, criterion scores for Roads and Slopes are calculated with an additional step of using the following formula:
Formula: 1 - MM(Xij)
This is because by subtracting the standardization value from 1 will allow us to get an inversion of the result, whereby the closer the roads or the lower the degree from roads and slope proximity raster layer, the higher the score will be. This will allow the analysis in the latter part to be processed in a more efficient manner.
For display purposes:
Criterion Score for Roads
Formula: 1 - (X - 0 meters ) / 772.01037597656 meters, higher score for land nearer to roads.
Criterion Score for Buildings
Fomula: (X – 0 meters) / 173.25415039063 meters
Criterion Score for Natural Areas
Fomula: (X – 0 meters) / 863.66949462891 meters
Criterion Score for Slope
Fomula: 1 – (X – 0 degrees) / 36.87947845459 degrees, higher score for slope with lesser degree.
The resultant criterion score will range from 0 to 1. A higher score indicates that the land site is more preferred and a lower score indicate the opposite.
Part 4: Analytical Hierarchical Process Input Matrix and Result Report
In order to find out the weightage, the relative importance of each factor, I have chosen the factors according to this order: i) Health risk factor
ii) Accessibility factor
iii) Economic factor
iv) Natural conservation factor
1. I put Health Risk Factor as the most important factor to take into consideration because the quarantine centre serves to prevent, contain and manage the spread of communicable diseases. Thus, it is logical and imperative to put relatively high importance on this factor.
2. Accessibility Factor is considered the second most important factor to consider because the high accessibility to roads, namely service roads and tracks will allow easy transportation during the construction stage. In order to reduce the time for transporting resources for construction and increase efficiency and time of completion, Accessibility Factor should come second to Health Risk Factor.
3. Economic Factor that indicate the selected site should avoid steep slope will be third most important factor to consider because based on the data from the slope analysis, most of Gombak subzone area has moderate slope degree. Hence, Accessibility Factor is favoured more than the Economic Factor because improved logistics may improve the delivery of resources needed for the cut-and-fill operation on steep slope.
4. Natural conservation comes last because among all 4 factors, natural conservation can be sacrificed in order to serve the better good of having a functioning national Communicable Disease Quarantine Centre.
The final results show that the most important factor is health risk (0.581), followed by accessibility (0.243) and economic factor (0.127), and lastly natural conservation factor (0.049).
Consistency is at 3%, lower than the benchmark 10%. This indicates that the inconsistency generated by the pairwise comparison matrix is still within the acceptable range and consistent with my importance scale on the 4 different factors.
Part 5: Map layout with suitability land lot(s)
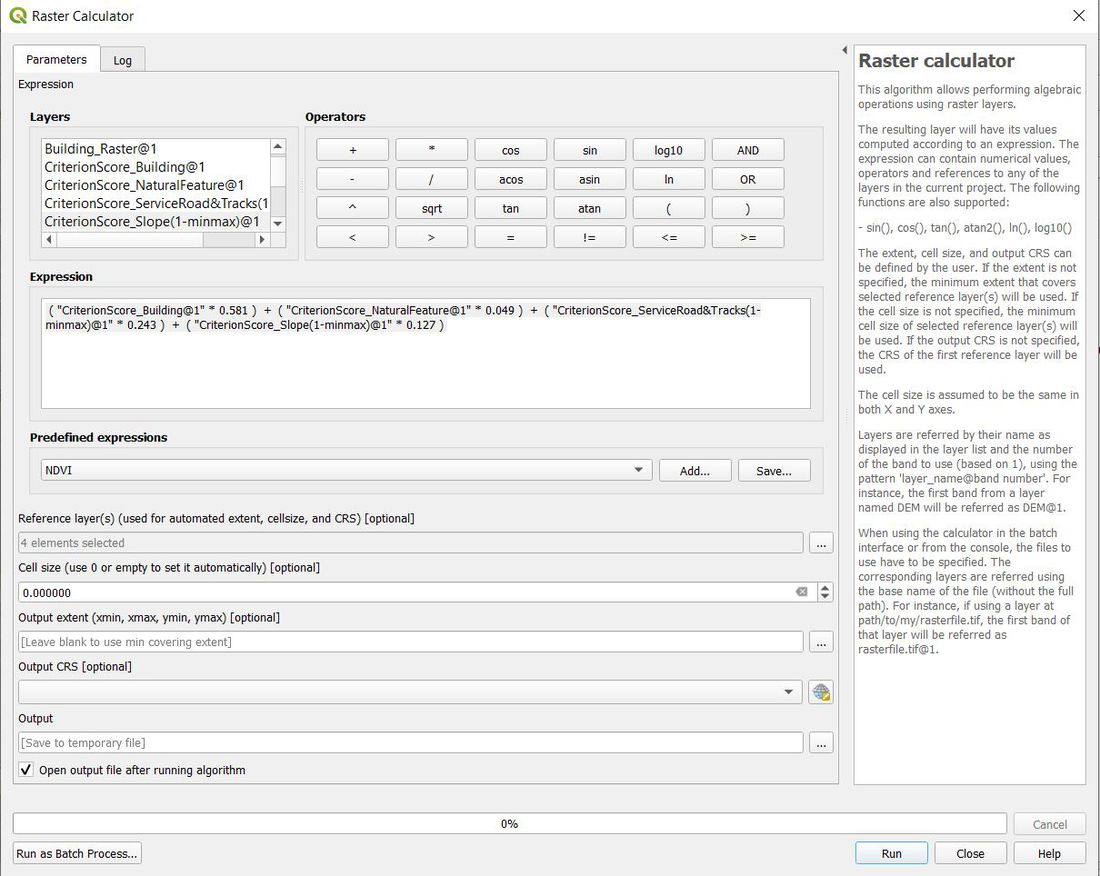
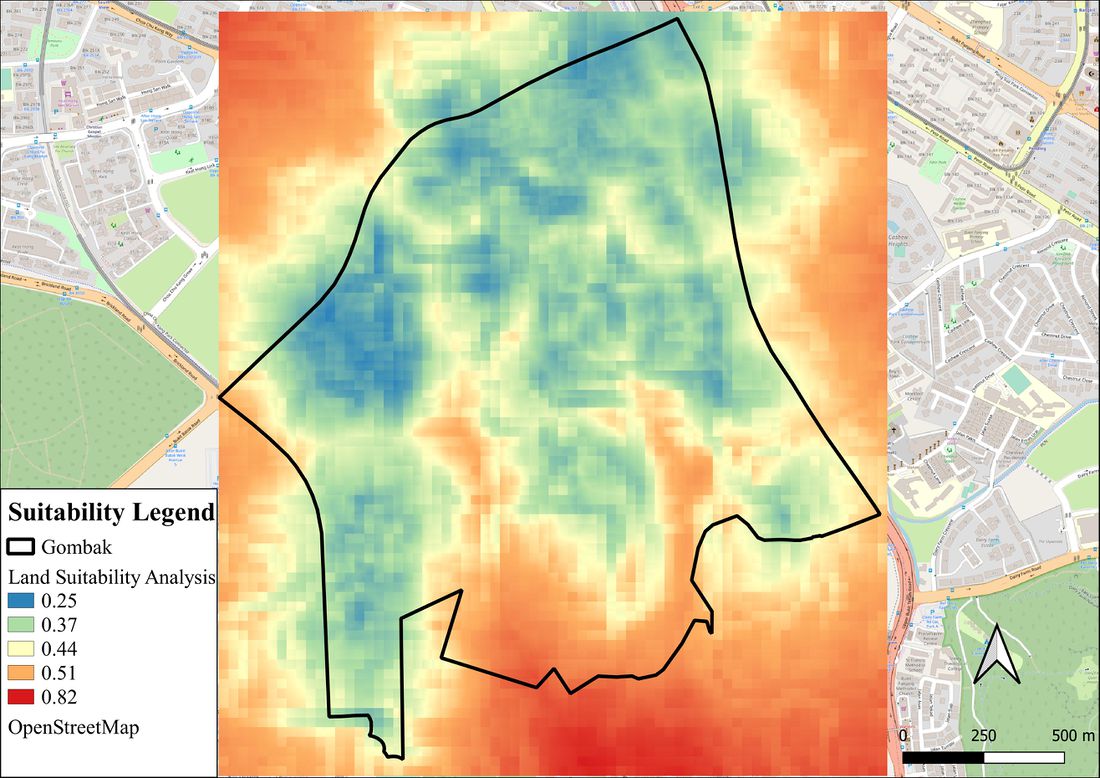
Formula for Generating Raster to evaluate suitability: ( "CriterionScore_Building@1" * 0.581 ) + ( "CriterionScore_NaturalFeature@1" * 0.049 ) + ( "CriterionScore_ServiceRoad&Tracks(1-minmax)@1" * 0.243 ) + ( "CriterionScore_Slope(1-minmax)@1" * 0.127 )
After running the raster calculator with the above mentioned formula for generating raster to evaluate suitability, a suitability Map is plotted.
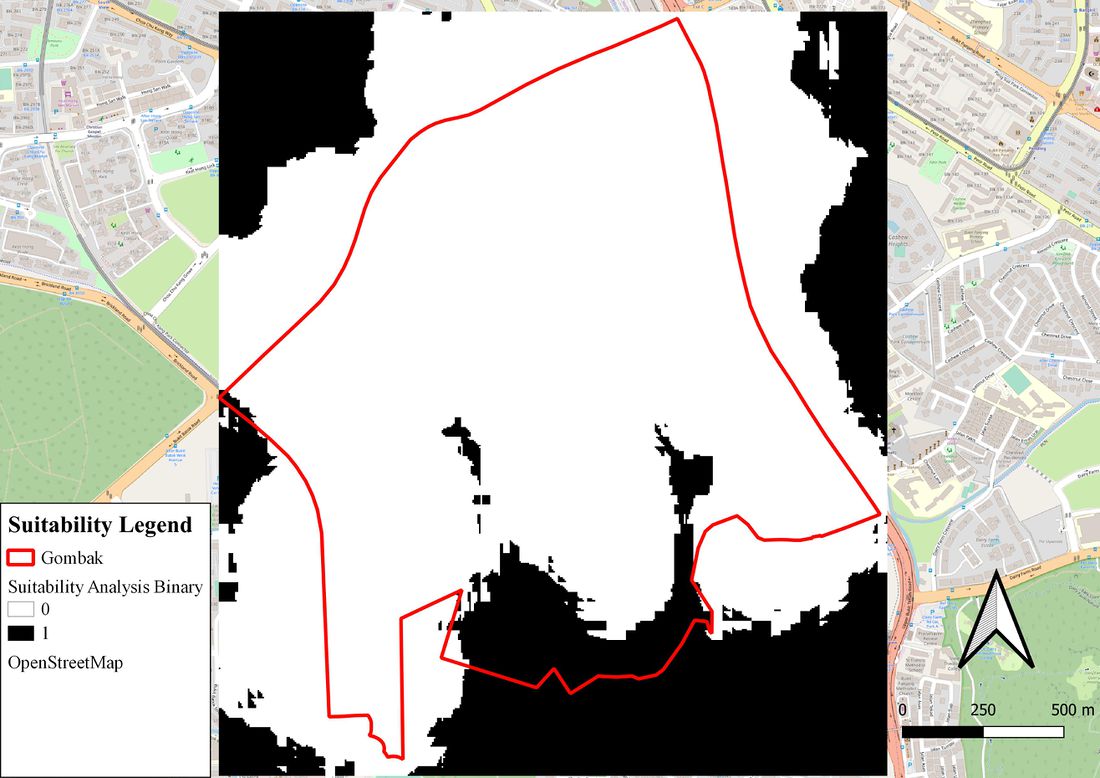
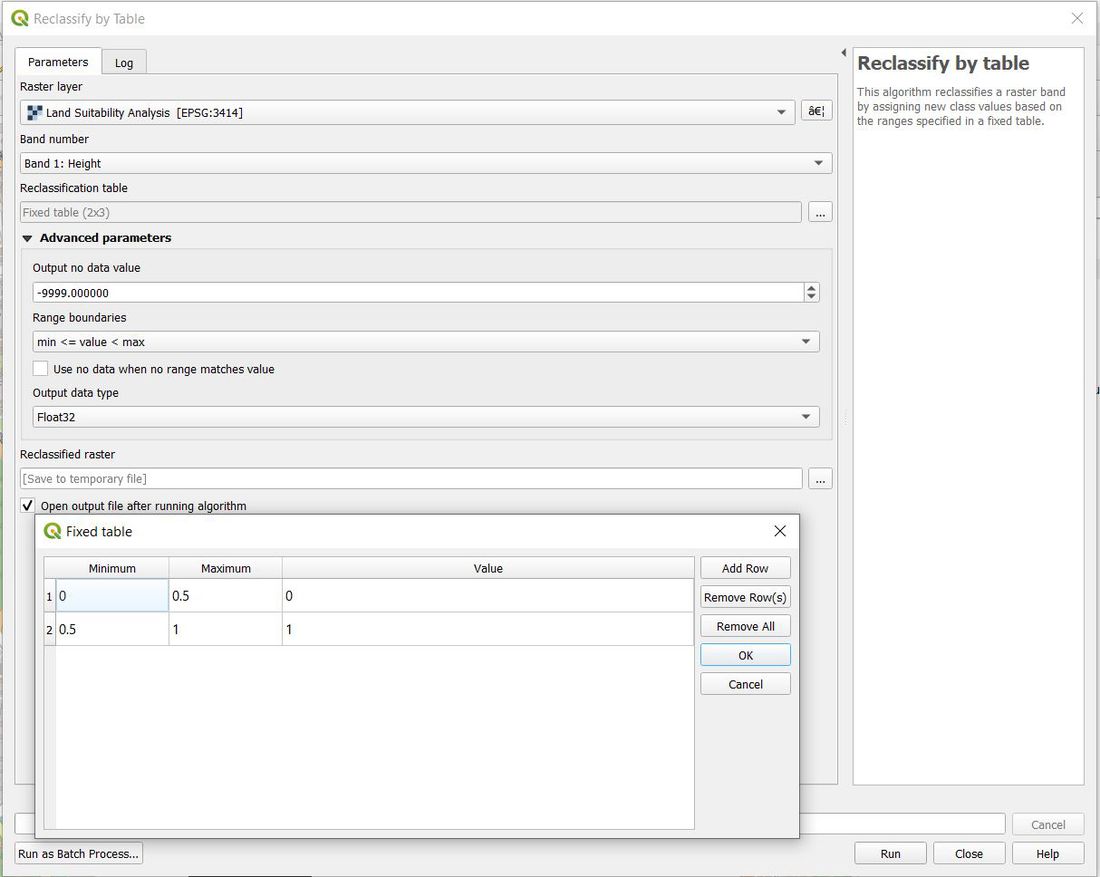
In order to find a suitable site for development, I ran Raster Analysis to Reclassify by Table to produce a binary layer that categorize 0 as not suitable and 1 as stuitable. Any raster pixel that was able to obtain >= 0.5 in terms of standardised score will be labelled as suitable pixel.
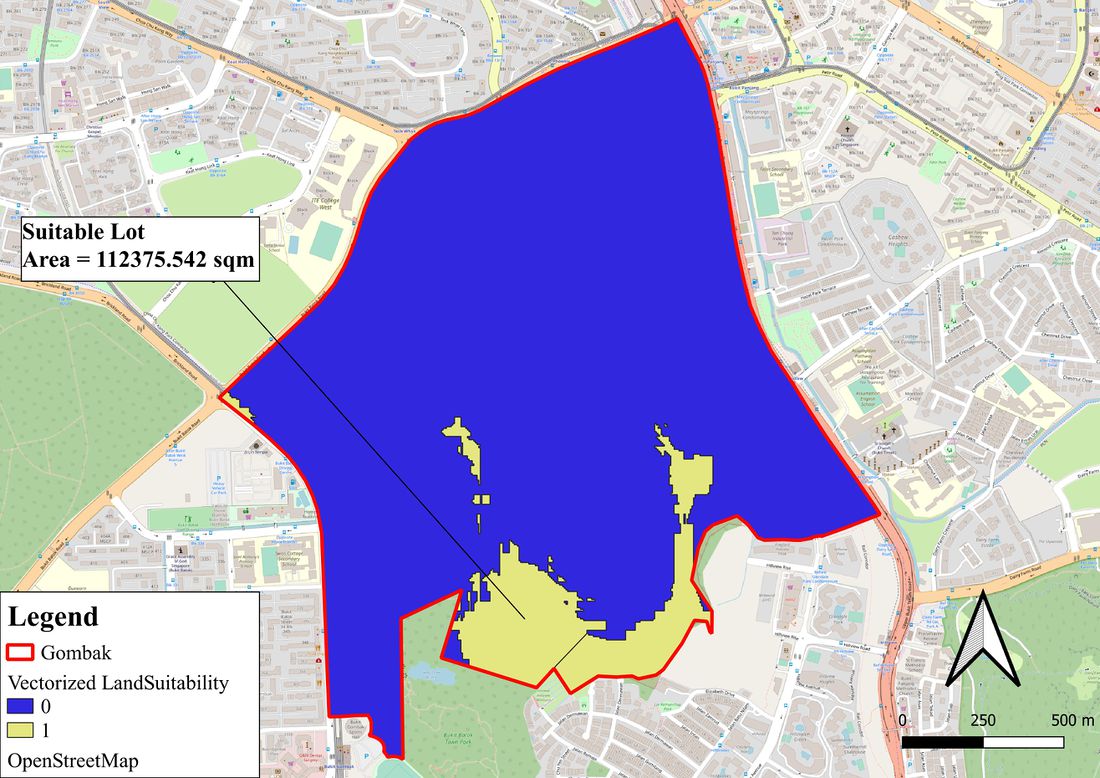
This was the results I obtained after Reclassifying. Then I proceed to vectorize the raster layer to find out the area of these plots.
The final map shows the result after converting from a raster to a vector. I performed slicing to the polygon as shown in the final map. Both polygon's area was bigger than 10,000 sqm after splitting. After much consideration, I argue that the Suitable Lot with arrow pointing out, stating the area is 112375.542 sqm is the best plot among all the other suitable plots. This is because it fulfills the basic requirement for the centre building and it is relatively further from human settlement compared to its adjacent polygon, thus making it very compelling to be considered as the most suitable plot for development.
