Difference between revisions of "SMT201 AY2019-20T1 EX2 Tay Jing Wen"
| (5 intermediate revisions by the same user not shown) | |||
| Line 2: | Line 2: | ||
[[File:Vector Format.png|1000x1000px|frameless|center]] | [[File:Vector Format.png|1000x1000px|frameless|center]] | ||
=== Description === | === Description === | ||
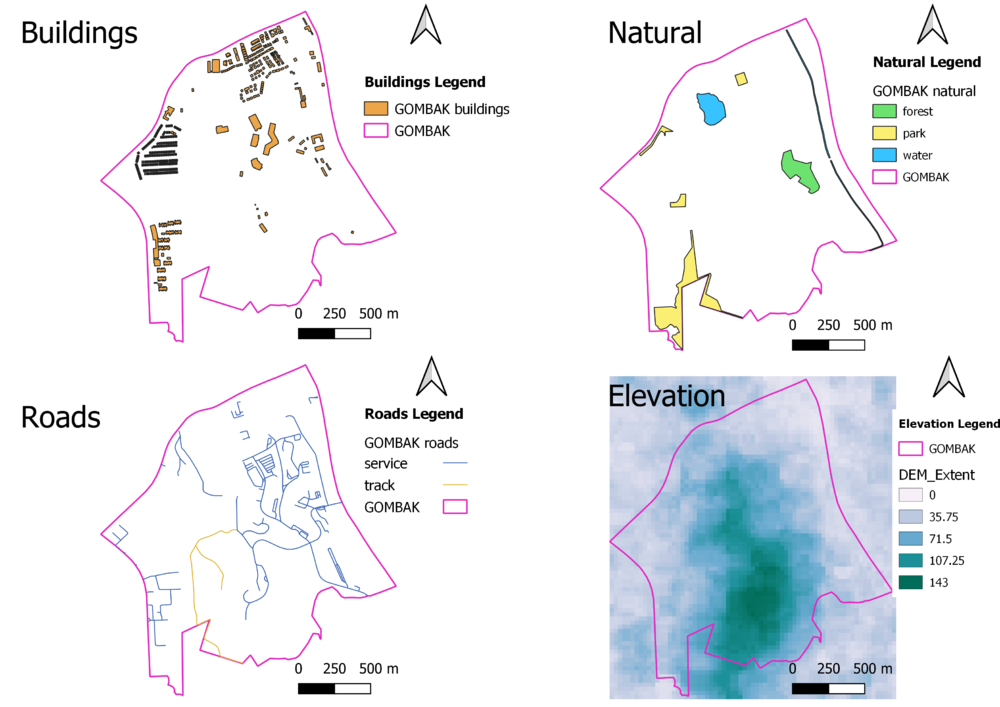
| − | Buildings: <br><br> | + | Buildings: This map layout will show the position of the building which accounts for the health risk factor as we want the Communicable Disease Quarantine Centre to be away from the crowd to prevent any spread of diseases. <br><br> |
| − | Natural: <br><br> | + | Natural: This map layout includes the natural elements in Gombak and is classified by their type, indicated in the legend. <br><br> |
| − | Roads: <br><br> | + | Roads: As the selected site should be close to the existing local roads, the local roads are categorized by their type and identified through different contrasting colors.<br><br> |
| − | Digital Elevation: <br><br> | + | Digital Elevation: The digital elevation indicates the steepness or gentleness of the land. The steeper it is, the higher the value is.<br><br> |
== PART 2: Gombak and the 4 Proximity Views == | == PART 2: Gombak and the 4 Proximity Views == | ||
| Line 11: | Line 11: | ||
[[File:Proximity Format.png|1000x1000px|frameless|center]] | [[File:Proximity Format.png|1000x1000px|frameless|center]] | ||
=== Description === | === Description === | ||
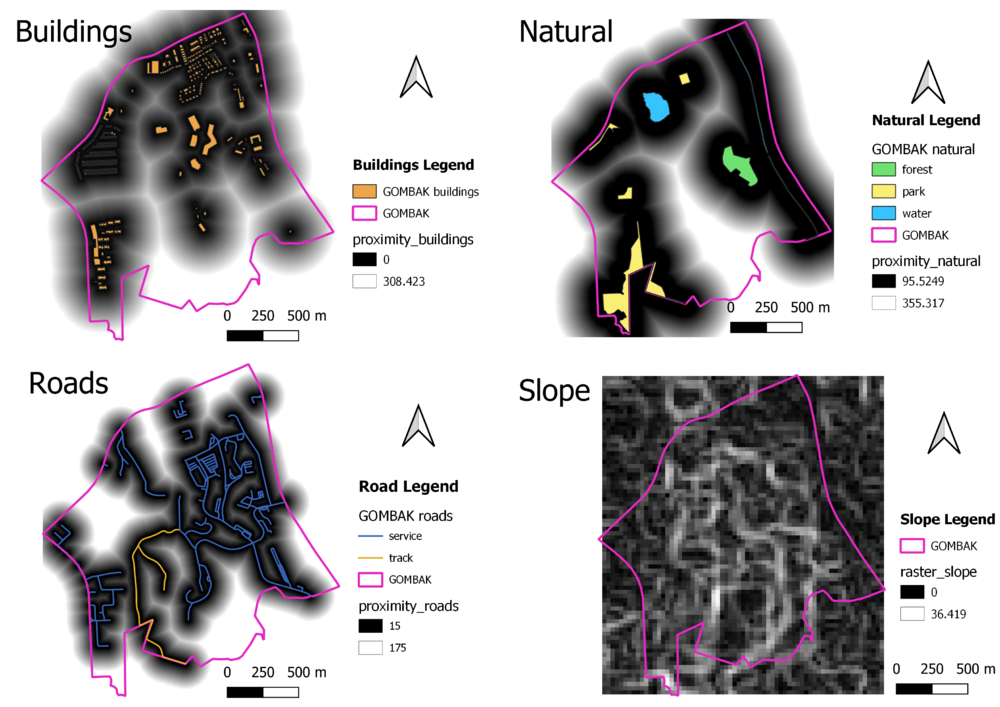
| − | + | The white areas in the maps are the recommended areas for the buildings and natural features as there are proximity to distance the Communicable Disease Quarantine Centre from the 2 features. The black areas in the maps for roads and slope are the recommended areas to have Communicable Disease Quarantine Centre built close to as closeness to roads mainly supports accessibility for the transport of materials and building on less elevated slopes lowers the development cost. | |
| − | |||
| − | |||
| − | |||
== PART 3: Criterion Score == | == PART 3: Criterion Score == | ||
| Line 20: | Line 17: | ||
=== Description === | === Description === | ||
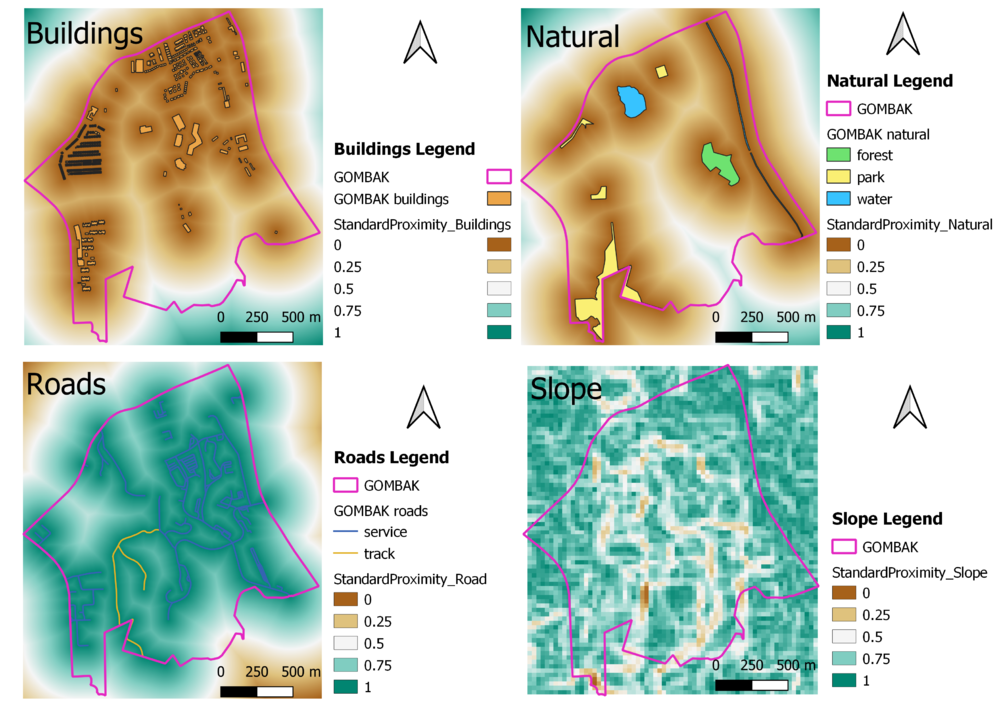
To apply Standardization with minmax, the minimum and maximum values are retrieve through Raster Layer Statistics. The following shows the formula and values to standardardize each layer.<br><br> | To apply Standardization with minmax, the minimum and maximum values are retrieve through Raster Layer Statistics. The following shows the formula and values to standardardize each layer.<br><br> | ||
| − | Buildings: (" | + | Buildings: ("proximity_buildings@1" - 0) / (838.4658813476562 - 0)<br><br> |
| − | Natural: (" | + | Natural: ("proximity_natural@1" - 0) / (863.6694946289062 - 0)<br><br> |
| − | Roads: (" | + | Roads: 1 - (("proximity_roads@1" - 0) / (743.303466796875 - 0))<br><br> |
| − | Slope: (" | + | Slope: 1 - (("raster_slope@1" - 0) / (36.41904830932617 - 0))<br><br> |
| − | + | The higher the score is as indicated in the legend, the better location will be for a Communicable Disease Quarantine Centre. | |
<br><br> | <br><br> | ||
| Line 33: | Line 30: | ||
<br><br> | <br><br> | ||
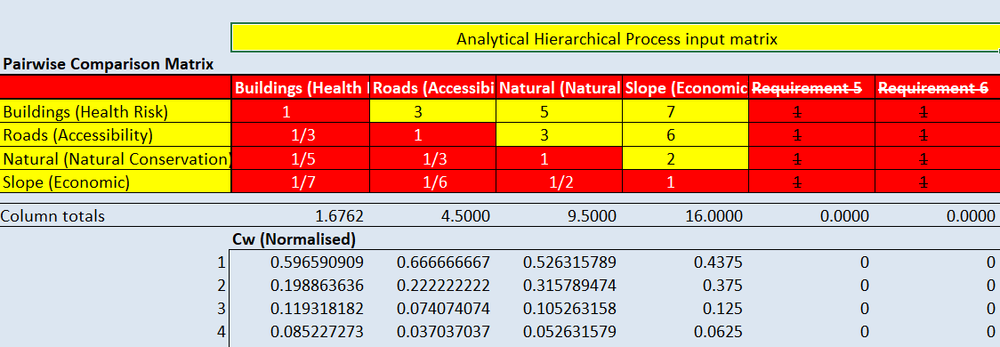
Reading from row to column, | Reading from row to column, | ||
| − | + | I find the importance level for the factors to be (High importance to Low importance): Health Risk, Accessibility, Natural conservation and Economic.<br> | |
| + | The higher the AHP Score, the more important the factor is when it comes to playing the part of choosing the suitable land lot. | ||
| + | The AHP score for each factor are as follows:<br> | ||
| + | <ul>Buildings (Health Risk): 0.557 <br></ul> | ||
| + | <ul>Roads (Accessibility): 0.278 <br></ul> | ||
| + | <ul>Natural (Natural Conservation): 0.106 <br></ul> | ||
| + | <ul>Slope (Economic): 0.059 <br><br></ul> | ||
| + | Furthermore, the consistency checker ensures accuracy in the values assigned in the AHP matrix. The current consistency checker returns a 5% score which indicates that the values assigned to each factor is consistent and within the accuracy range (below 10%).<br> | ||
== PART 5: Suitability Land Lot == | == PART 5: Suitability Land Lot == | ||
| − | + | === Maps === | |
| + | [[File:Suitability 2.png|1000x1000px|frameless|center]] | ||
| + | <br><br> | ||
| + | The above suitability raster map is generated through this formula: <br> | ||
| + | ("StandardProximity_Buildings@1" * 0.557) + ("StandardProximity_Natural@1" * 0.106) + ("StandardProximity_Road@1" * 0.278) + ("StandardProximity_Slope@1" * 0.059) | ||
| + | <br><br> | ||
| + | To be able to clearly identify the suitable land lot in the generated suitability map, the layer was reclassified with:<br> | ||
| + | min <= value < max of:<br> | ||
| + | <ul>min: 0, max 0.6 => 0 (unsuitable)<br></ul> | ||
| + | <ul>min: 0.6, max 0.7 => 1 (suitable)<br></ul> | ||
| + | === Land Lot === | ||
| + | [[File:Land Lot1.png|1000x1000px|frameless|center]] | ||
<br><br> | <br><br> | ||
| + | Fulfilling the requirement of contiguous area of at least 10,000m2 for the Communicable Disease Quarantine Centre, the land lot area with a size of 21,508m2 is suitable to build a Communicable Disease Quarantine Centre. | ||
Latest revision as of 23:17, 10 November 2019
Contents
PART 1: Gombak and the 4 Target Views
Description
Buildings: This map layout will show the position of the building which accounts for the health risk factor as we want the Communicable Disease Quarantine Centre to be away from the crowd to prevent any spread of diseases.
Natural: This map layout includes the natural elements in Gombak and is classified by their type, indicated in the legend.
Roads: As the selected site should be close to the existing local roads, the local roads are categorized by their type and identified through different contrasting colors.
Digital Elevation: The digital elevation indicates the steepness or gentleness of the land. The steeper it is, the higher the value is.
PART 2: Gombak and the 4 Proximity Views
Description
The white areas in the maps are the recommended areas for the buildings and natural features as there are proximity to distance the Communicable Disease Quarantine Centre from the 2 features. The black areas in the maps for roads and slope are the recommended areas to have Communicable Disease Quarantine Centre built close to as closeness to roads mainly supports accessibility for the transport of materials and building on less elevated slopes lowers the development cost.
PART 3: Criterion Score
Description
To apply Standardization with minmax, the minimum and maximum values are retrieve through Raster Layer Statistics. The following shows the formula and values to standardardize each layer.
Buildings: ("proximity_buildings@1" - 0) / (838.4658813476562 - 0)
Natural: ("proximity_natural@1" - 0) / (863.6694946289062 - 0)
Roads: 1 - (("proximity_roads@1" - 0) / (743.303466796875 - 0))
Slope: 1 - (("raster_slope@1" - 0) / (36.41904830932617 - 0))
The higher the score is as indicated in the legend, the better location will be for a Communicable Disease Quarantine Centre.
PART 4: Analytical Hierarchical Process Input Matrix
Reading from row to column,
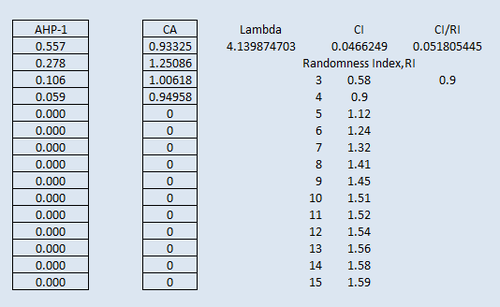
I find the importance level for the factors to be (High importance to Low importance): Health Risk, Accessibility, Natural conservation and Economic.
The higher the AHP Score, the more important the factor is when it comes to playing the part of choosing the suitable land lot.
The AHP score for each factor are as follows:
- Buildings (Health Risk): 0.557
- Roads (Accessibility): 0.278
- Natural (Natural Conservation): 0.106
- Slope (Economic): 0.059
Furthermore, the consistency checker ensures accuracy in the values assigned in the AHP matrix. The current consistency checker returns a 5% score which indicates that the values assigned to each factor is consistent and within the accuracy range (below 10%).
PART 5: Suitability Land Lot
Maps
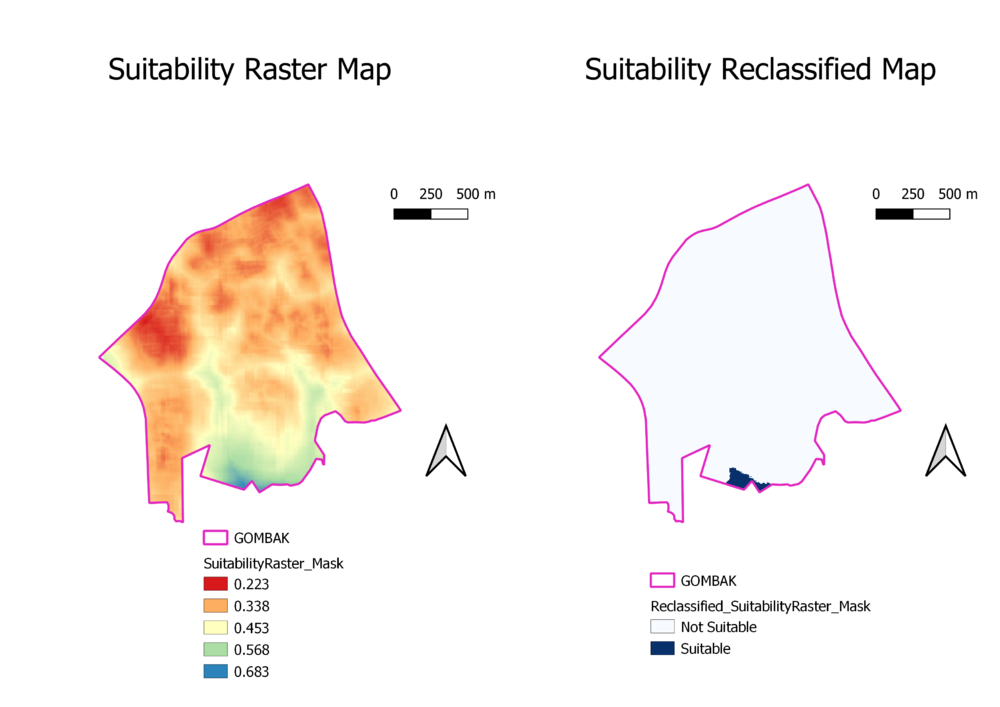
The above suitability raster map is generated through this formula:
("StandardProximity_Buildings@1" * 0.557) + ("StandardProximity_Natural@1" * 0.106) + ("StandardProximity_Road@1" * 0.278) + ("StandardProximity_Slope@1" * 0.059)
To be able to clearly identify the suitable land lot in the generated suitability map, the layer was reclassified with:
min <= value < max of:
- min: 0, max 0.6 => 0 (unsuitable)
- min: 0.6, max 0.7 => 1 (suitable)
Land Lot
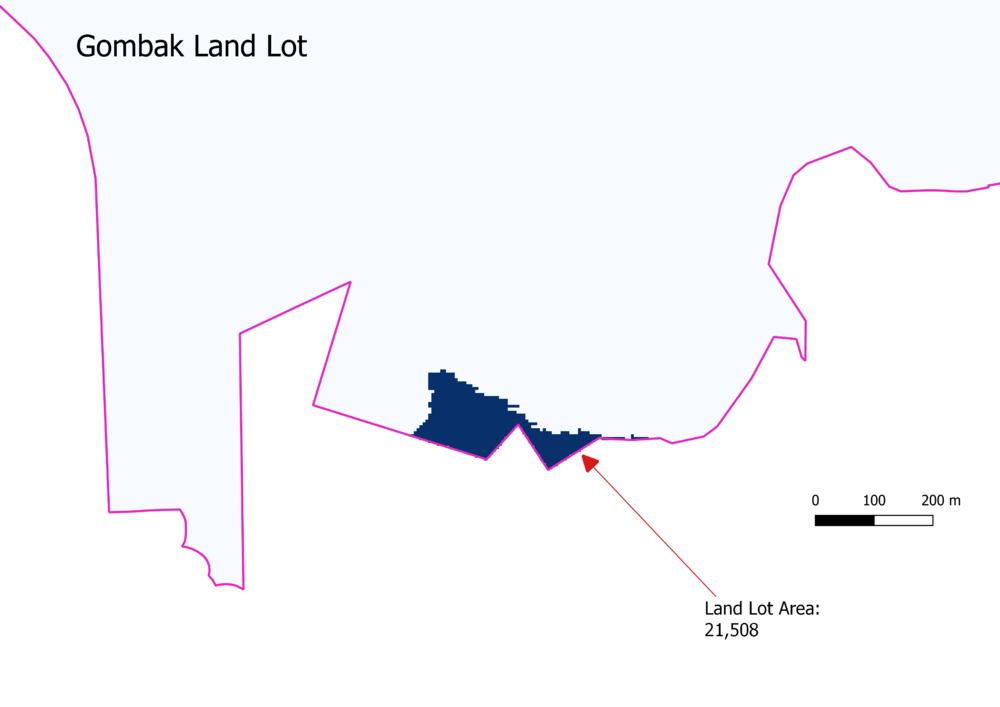
Fulfilling the requirement of contiguous area of at least 10,000m2 for the Communicable Disease Quarantine Centre, the land lot area with a size of 21,508m2 is suitable to build a Communicable Disease Quarantine Centre.
