Difference between revisions of "SMT201 AY2019-20T1 EX2 Lee Jung Jae"
(Created page with "== Part 1: A map layout with four views showing Gombak (Roads, Natural Features, Buildings and Elevation) == 800px|center === Roads === === Buildi...") |
|||
| (12 intermediate revisions by the same user not shown) | |||
| Line 1: | Line 1: | ||
| − | == Part | + | == Part I: A map layout with four views showing Gombak (Roads, Natural Features, Buildings and Elevation) == |
[[File:PART 1 FINAL.png|800px|center]] | [[File:PART 1 FINAL.png|800px|center]] | ||
=== Roads === | === Roads === | ||
| + | The Roads layer shows all the roads and their types that exists within Gombak Subzone area. From the illustration, we can see that there are many sparse areas where there are no roads network at all. This could indicate that there are possibly many areas that are suitable or not suitable for building a national Communicable Disease Quarantine Centre. Further analysis is required to make a decision. | ||
| + | === Natural Features === | ||
| + | The Natural features layer illustrates the different types of natural bodies that exist within Gombak Subzone area (Forest, Park, and Waterbody). As similar to the road network, there aren't much attributes within the natural features inside Gombak Subzone area. | ||
=== Buildings === | === Buildings === | ||
| + | The Buildings layer shows the distribution of buildings inside the Gombak Subzone area. As illustrated, we can witness that most of the buildings exist at the boundaries of Gombak area and only a few exists within the central area. | ||
| + | |||
| + | === Elevation model === | ||
| + | Building on from the previous layers descriptions, we can see through the elevation map that the Central to the Southern part of Gombak Subzone area have high-elevation characteristics, making it difficult for the places to be developed with buildings and roads. | ||
| + | == Part II: A map layout with four views showing Proximity to Gombak Roads, Natural Features, Buildings and Slope == | ||
| + | [[File:PART 2 FINAL.png|800px|center]] | ||
| − | === Natural Features === | + | === Roads Proximity === |
| + | The roads proximity map shows the proximity level of roads that exist within Gombak Subzone area. The darker areas represent closer proximity level, indicating that there are many areas within Gombak subzone area that are fairly accessible from the roads. | ||
| + | |||
| + | === Natural Features Proximity === | ||
| + | The white colors in the map represent high level of proximity in this layer. As seen in the illustration above, we can notice that there are several white spots that passes throughout the central and southern region of Gombak Subzone area. This indicates that most of the natural features are fairly far away from one another. | ||
| + | |||
| + | === Buildings Proximity === | ||
| + | As illustrated in part 1, we can already see that most of the buildings inside the Gombak Subzone area are quite spread out throughout the central, north, and west regions. As such, we can spot the white colors, which represents high level of proximity, throughout the different parts of Gombak Subzone area. | ||
| + | === Slope Proximity === | ||
| + | The dark areas indicate a lower and more gentle slope compared to the white areas. From the illustration, we can see that there are various level of slopes that exist throughout the Gombak Subzone areas. | ||
| − | == | + | == Part III: A map layout showing the criterion scores of each factor layers == |
| + | [[File:PART 3 FINAL..png|800px|center]] | ||
| + | In order to standardize the values to prepare for criterion scoring models, the Z-score (MinMax) Standardization approach was used. <br/> | ||
| + | Standardization = [Proximity to Features - Min(Proximity to Features)] / [Max(Proximity to Features) - Min(Proximity to Features)] | ||
| − | == | + | === Roads Criterion Scores === |
| − | [[ | + | Min = 0, Max = 750 <br/> |
| + | Calculation method: 1 - [RoadsProximity - Min(RoadsProximity )] / [Max(RoadsProximity ) - Min(RoadsProximity )] | ||
| − | === | + | === Natural Features Criterion Score === |
| − | + | Min = 0, Max = 905 <br/> | |
| + | Calculation method: [NaturalFeaturesProximity - Min(NaturalFeaturesProximity)] / [Max(NaturalFeaturesProximity) - Min(NaturalFeaturesProximity)] | ||
| − | === | + | === Buildings Criterion Score === |
| − | + | Min = 0, Max = 868 <br/> | |
| + | Calculation method: [BuildingsProximity - Min(BuildingsProximity)] / [Max(BuildingsProximity) - Min(BuildingsProximity)] | ||
| − | === | + | === Slope Criterion Score === |
| − | + | Min = 0, Max = 34.5 <br/> | |
| + | Calculation method: 1 - [SlopeProximity - Min(SlopeProximity)] / [Max(SlopeProximity) - Min(SlopeProximity)] | ||
| − | == | + | == Part IV: Analytical Hierarchical Process input matrix and result report == |
| − | + | [[File:AHP Rankings.png|1000px|center]] | |
| − | == | + | ===Description=== |
| − | + | This AHP input matrix and result report was generated by using the AHP template provided by AHP Template provided by [https://www.google.com/url?sa=t&rct=j&q=&esrc=s&source=web&cd=17&ved=2ahUKEwi198HV87_lAhXhjuYKHWn1AnEQFjAQegQICRAC&url=http%3A%2F%2Fwww.scbuk.com%2FAHP%2520Template%2520SCBUK.xls&usg=AOvVaw002J8QfYIxOE_I9PYqrH8_ SCB Associates]. Since the very purpose of this illustration is to find out the optimal location suitable for building a national Communicable Disease Quarantine Centre, it is important to consider the Health Risk Factor as number one priority among the four factors. The importance AHP percentage weights given to each respective factors are as follows: <br/> | |
| − | [ | ||
| − | |||
| − | |||
| − | === | ||
| − | |||
| − | |||
| − | |||
| − | + | 1. Health Risk Factor: 48% <br/> | |
| − | + | 2. Accessibility Factor: 30.9% <br/> | |
| − | + | 3. Economic Factor: 13.7% <br/> | |
| + | 4. Natural Conservation Factor: 7.4% | ||
| − | |||
| − | |||
| − | |||
| − | == | + | == Part V: A map layout with the suitability land lot(s) == |
| − | + | [[File:(Suitability).png|600px|center]] | |
| − | |||
| − | |||
| − | + | The suitability of the land to decide whether the land is suitable for building a national Communicable Disease Quarantine Center was found using the following calculation method: <br/> | |
| − | + | ("BuildingProximity"*0.48)+("RoadProximity"*0.309)+("SlopeProximity"*0.137)+("NaturalFeaturesProximity"*0.074)<br/> | |
| − | + | The map was generated through using the raster calculation tool on QGIS. The result shows that only few areas (indicated with orange polygon) in the Southern region are the most suitable land for building a national Communicable Disease Quarantine Center. <br/> | |
| − | |||
| − | == | + | ===References for data used=== |
| − | + | 1. MasterPlan 2014 Subzone (No Sea) retrieved from: https://data.gov.sg/dataset/master-plan-2014-subzone-boundary-no-sea <br/> | |
| + | 2. Roads, buildings and natural features data from OpenStreetMap (OSM) data sets retrieved from: https://download.bbbike.org/osm/bbbike/Singapore/ <br/> | ||
| + | 3. ASTER Global Digital Elevation Model (GDEM) dataset jointly prepared by NASA and METI, Japan retrieved from: https://search.earthdata.nasa.gov/search?m=-7.175!25.59375!1!1!0!0%2C2 <br/> | ||
| + | 4. Excel-based AHP Template retrieved from: https://www.google.com/url?sa=t&rct=j&q=&esrc=s&source=web&cd=17&ved=2ahUKEwi198HV87_lAhXhjuYKHWn1AnEQFjAQegQICRAC&url=http%3A%2F%2Fwww.scbuk.com%2FAHP%2520Template%2520SCBUK.xls&usg=AOvVaw002J8QfYIxOE_I9PYqrH8_ | ||
Latest revision as of 23:00, 10 November 2019
Contents
- 1 Part I: A map layout with four views showing Gombak (Roads, Natural Features, Buildings and Elevation)
- 2 Part II: A map layout with four views showing Proximity to Gombak Roads, Natural Features, Buildings and Slope
- 3 Part III: A map layout showing the criterion scores of each factor layers
- 4 Part IV: Analytical Hierarchical Process input matrix and result report
- 5 Part V: A map layout with the suitability land lot(s)
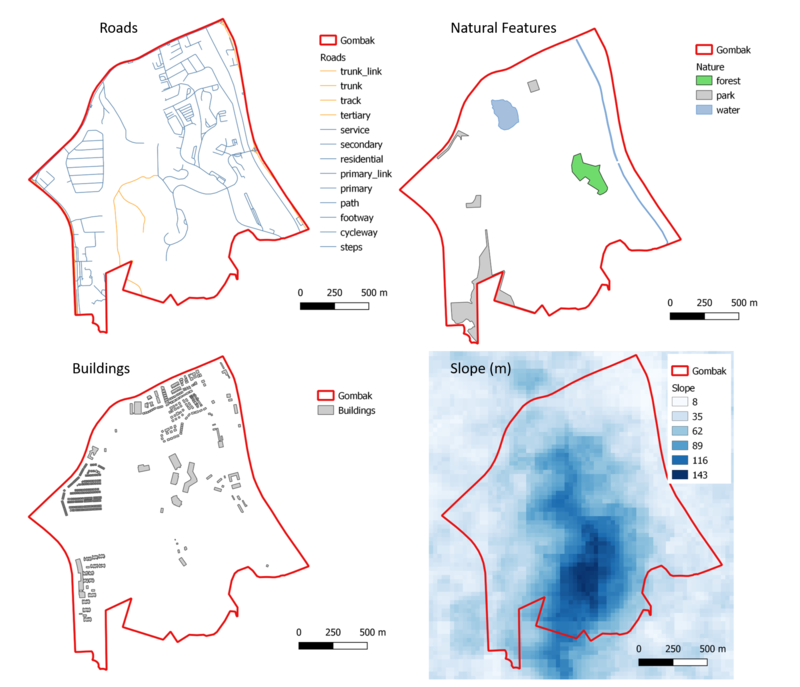
Part I: A map layout with four views showing Gombak (Roads, Natural Features, Buildings and Elevation)
Roads
The Roads layer shows all the roads and their types that exists within Gombak Subzone area. From the illustration, we can see that there are many sparse areas where there are no roads network at all. This could indicate that there are possibly many areas that are suitable or not suitable for building a national Communicable Disease Quarantine Centre. Further analysis is required to make a decision.
Natural Features
The Natural features layer illustrates the different types of natural bodies that exist within Gombak Subzone area (Forest, Park, and Waterbody). As similar to the road network, there aren't much attributes within the natural features inside Gombak Subzone area.
Buildings
The Buildings layer shows the distribution of buildings inside the Gombak Subzone area. As illustrated, we can witness that most of the buildings exist at the boundaries of Gombak area and only a few exists within the central area.
Elevation model
Building on from the previous layers descriptions, we can see through the elevation map that the Central to the Southern part of Gombak Subzone area have high-elevation characteristics, making it difficult for the places to be developed with buildings and roads.
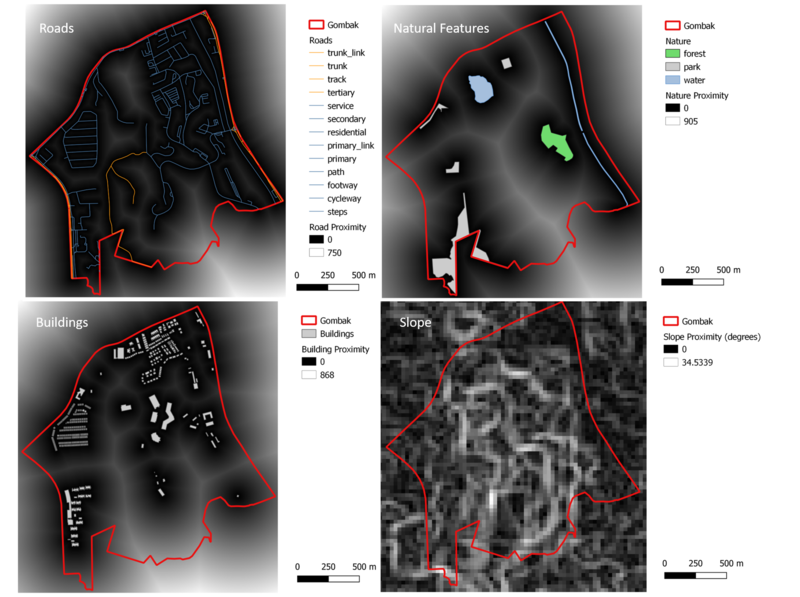
Part II: A map layout with four views showing Proximity to Gombak Roads, Natural Features, Buildings and Slope
Roads Proximity
The roads proximity map shows the proximity level of roads that exist within Gombak Subzone area. The darker areas represent closer proximity level, indicating that there are many areas within Gombak subzone area that are fairly accessible from the roads.
Natural Features Proximity
The white colors in the map represent high level of proximity in this layer. As seen in the illustration above, we can notice that there are several white spots that passes throughout the central and southern region of Gombak Subzone area. This indicates that most of the natural features are fairly far away from one another.
Buildings Proximity
As illustrated in part 1, we can already see that most of the buildings inside the Gombak Subzone area are quite spread out throughout the central, north, and west regions. As such, we can spot the white colors, which represents high level of proximity, throughout the different parts of Gombak Subzone area.
Slope Proximity
The dark areas indicate a lower and more gentle slope compared to the white areas. From the illustration, we can see that there are various level of slopes that exist throughout the Gombak Subzone areas.
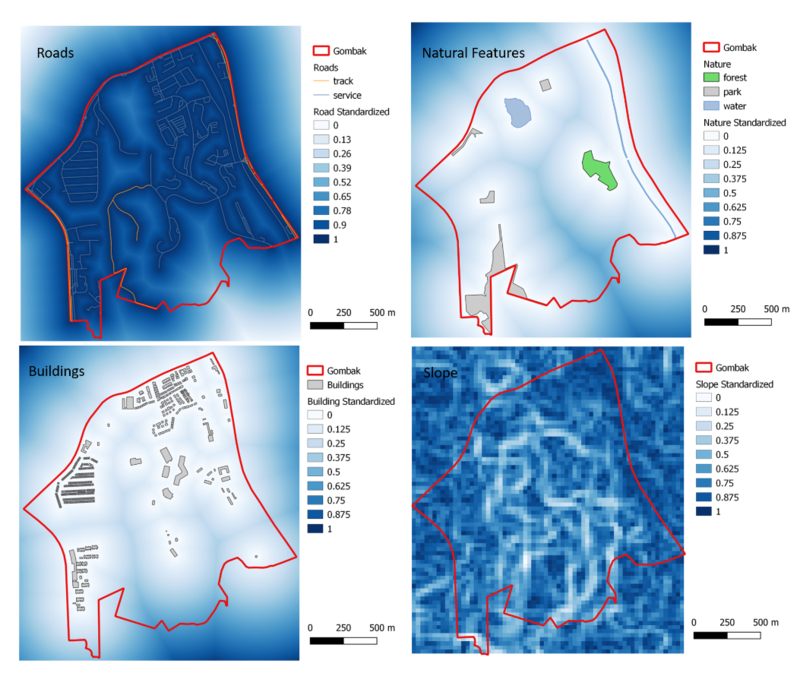
Part III: A map layout showing the criterion scores of each factor layers
In order to standardize the values to prepare for criterion scoring models, the Z-score (MinMax) Standardization approach was used.
Standardization = [Proximity to Features - Min(Proximity to Features)] / [Max(Proximity to Features) - Min(Proximity to Features)]
Roads Criterion Scores
Min = 0, Max = 750
Calculation method: 1 - [RoadsProximity - Min(RoadsProximity )] / [Max(RoadsProximity ) - Min(RoadsProximity )]
Natural Features Criterion Score
Min = 0, Max = 905
Calculation method: [NaturalFeaturesProximity - Min(NaturalFeaturesProximity)] / [Max(NaturalFeaturesProximity) - Min(NaturalFeaturesProximity)]
Buildings Criterion Score
Min = 0, Max = 868
Calculation method: [BuildingsProximity - Min(BuildingsProximity)] / [Max(BuildingsProximity) - Min(BuildingsProximity)]
Slope Criterion Score
Min = 0, Max = 34.5
Calculation method: 1 - [SlopeProximity - Min(SlopeProximity)] / [Max(SlopeProximity) - Min(SlopeProximity)]
Part IV: Analytical Hierarchical Process input matrix and result report
Description
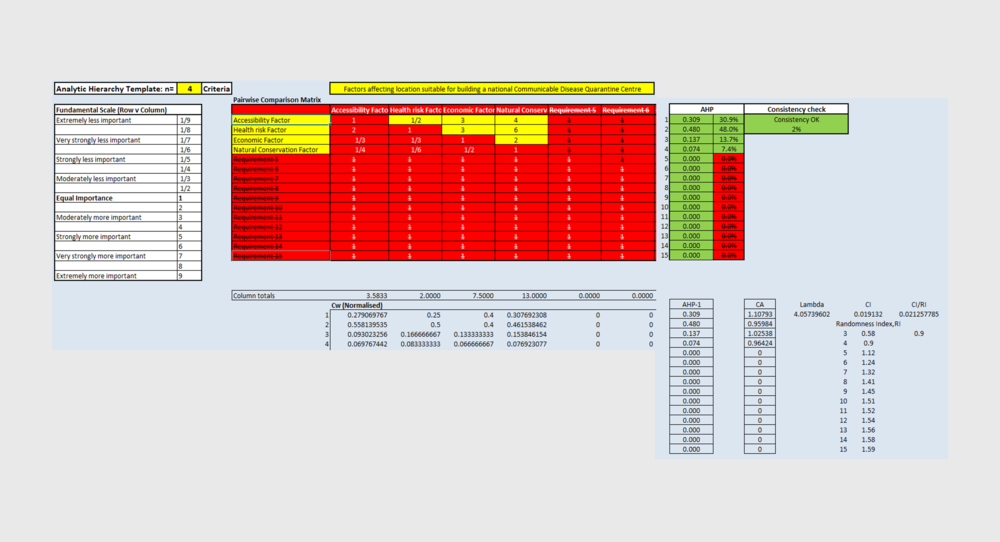
This AHP input matrix and result report was generated by using the AHP template provided by AHP Template provided by SCB Associates. Since the very purpose of this illustration is to find out the optimal location suitable for building a national Communicable Disease Quarantine Centre, it is important to consider the Health Risk Factor as number one priority among the four factors. The importance AHP percentage weights given to each respective factors are as follows:
1. Health Risk Factor: 48%
2. Accessibility Factor: 30.9%
3. Economic Factor: 13.7%
4. Natural Conservation Factor: 7.4%
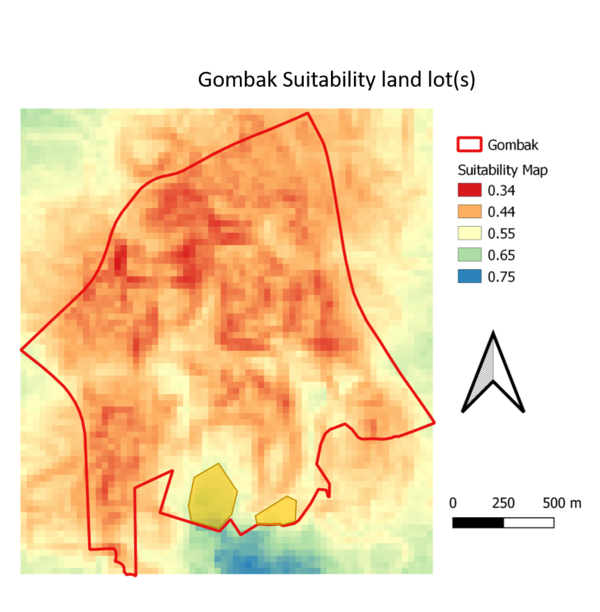
Part V: A map layout with the suitability land lot(s)
The suitability of the land to decide whether the land is suitable for building a national Communicable Disease Quarantine Center was found using the following calculation method:
("BuildingProximity"*0.48)+("RoadProximity"*0.309)+("SlopeProximity"*0.137)+("NaturalFeaturesProximity"*0.074)
The map was generated through using the raster calculation tool on QGIS. The result shows that only few areas (indicated with orange polygon) in the Southern region are the most suitable land for building a national Communicable Disease Quarantine Center.
References for data used
1. MasterPlan 2014 Subzone (No Sea) retrieved from: https://data.gov.sg/dataset/master-plan-2014-subzone-boundary-no-sea
2. Roads, buildings and natural features data from OpenStreetMap (OSM) data sets retrieved from: https://download.bbbike.org/osm/bbbike/Singapore/
3. ASTER Global Digital Elevation Model (GDEM) dataset jointly prepared by NASA and METI, Japan retrieved from: https://search.earthdata.nasa.gov/search?m=-7.175!25.59375!1!1!0!0%2C2
4. Excel-based AHP Template retrieved from: https://www.google.com/url?sa=t&rct=j&q=&esrc=s&source=web&cd=17&ved=2ahUKEwi198HV87_lAhXhjuYKHWn1AnEQFjAQegQICRAC&url=http%3A%2F%2Fwww.scbuk.com%2FAHP%2520Template%2520SCBUK.xls&usg=AOvVaw002J8QfYIxOE_I9PYqrH8_
