Difference between revisions of "SMT201 AY2019-20G1 Ex2 Lim Shen Jie"
| (15 intermediate revisions by the same user not shown) | |||
| Line 2: | Line 2: | ||
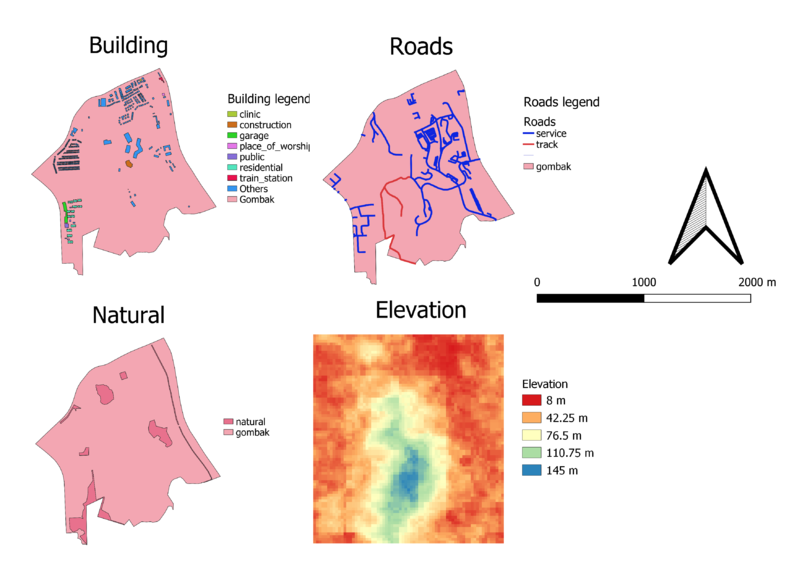
[[File:LSJ Standard four.png|800px|thumb|center|Standard view of study areas]] | [[File:LSJ Standard four.png|800px|thumb|center|Standard view of study areas]] | ||
==== Description ==== | ==== Description ==== | ||
| − | + | 1. Buildings - Classified buildings by color into clinic, construction, garage, place of worship, public, residential, train station, and others. <br/> | |
| + | 2. Natural - Classified natural as one single color.<br/> | ||
| + | 3. Roads - Classified roads into service and track. Any other type of roads were excluded from the study.<br/> | ||
| + | 4. Elevation - Classified the elevation into colors, representing different heights<br/> | ||
== Part 2: Raster view of the study areas == | == Part 2: Raster view of the study areas == | ||
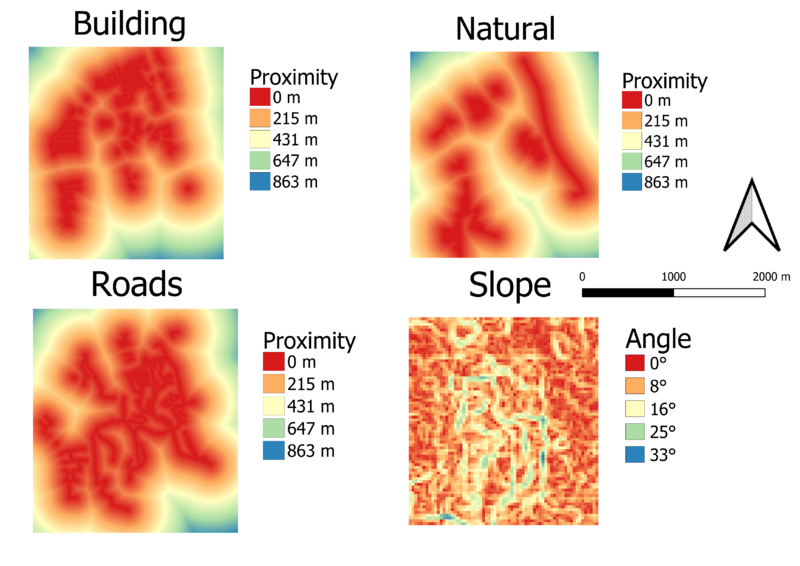
[[File:LSJ Raster four view.png|800px|thumb|center|Raster view of the study areas]] | [[File:LSJ Raster four view.png|800px|thumb|center|Raster view of the study areas]] | ||
==== Description ==== | ==== Description ==== | ||
| − | + | 1. Buildings - Classified proximity by color. Numbers are in metres. <br/> | |
| + | 2. Natural - Classified proximity by color. Numbers are in metres.<br/> | ||
| + | 3. Roads - Classified proximity by color. Numbers are in metres.<br/> | ||
| + | 4. Elevation - Classified proximity by color. Numbers are in metres.<br/> | ||
== Part 3: Raster view showing the criterion scores of the study areas == | == Part 3: Raster view showing the criterion scores of the study areas == | ||
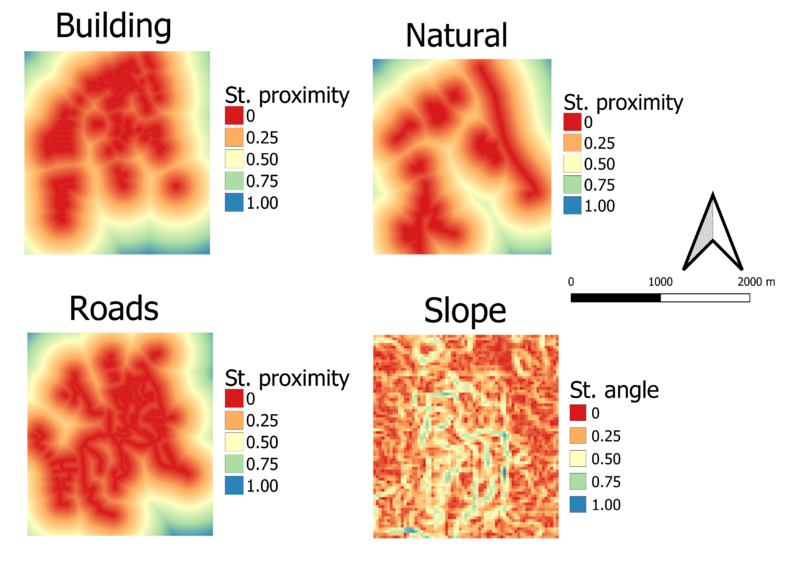
| − | [[File:Minmax.png|800px|thumb|center|Raster view showing the criterion scores of the study areas]] | + | [[File:LSJ Minmax.png|800px|thumb|center|Raster view showing the criterion scores of the study areas]] |
| − | + | ==== Description ==== | |
| + | 1. Buildings - Classified proximity by color. Numbers are standardized by reclassifying by table. <br/> | ||
| + | 2. Natural - Classified proximity by color. Numbers are standardized using reclassifying by table.<br/> | ||
| + | 3. Roads - Classified proximity by color. Numbers are standardized using reclassifying by table.<br/> | ||
| + | 4. Elevation - Classified proximity by color. Numbers are standardized using reclassifying by table.<br/> | ||
== Part 4: AHP tables == | == Part 4: AHP tables == | ||
| − | [[File:LSJ | + | [[File:LSJ AHP3.JPG|800px|thumb|center|Pair-wise comparison]] |
| − | [[File:LSJ AHP column | + | [[File:LSJ AHP column totals2.JPG|800px|thumb|center|Resulting weightage]] |
| + | [[File:LSJ Consistency check2.JPG|800px|thumb|center|Consistency check]] | ||
==== Description ==== | ==== Description ==== | ||
| − | + | 1. Health Risk - It is the most important factor to take into consideration as this will affect people staying the area, thus it is scored very highly as compared to the other 3 factors. <br/> | |
| + | 2. Accessibility - It is the second most important factor. Accessibility to the site would affect the cost required to transport the construction tools and materials for the new building. Making it cost-effective would be important.<br/> | ||
| + | 3. Slope angle - As mentioned, slope angle is the third most important factor. Building on steep angle would increase costs of construction and potentially increase the duration of construction. Thus, ensuring the project is finished quickly and cost-effectively would be important.<br/> | ||
| + | 4. Natural Conservation - it is the least important factor compared to the others. Failure to consider the presence of forests and lakes would endanger the plants and animals in these habitats. However, the costs of these damages are minor compared to the previously mentioned factors. Thus, it's score is relatively low compared to the rest.<br/> | ||
== Part 5: Suitable land == | == Part 5: Suitable land == | ||
| − | [[File:LSJ Suitable | + | [[File:LSJ Suitable land2.png|800px|thumb|center|from suitable_land layer, RankedwithAHP layer, Gombak_Outline layer]] |
==== Discussion ==== | ==== Discussion ==== | ||
| + | [[File:LSJ Raster calculation3.JPG|800px|thumb|center|Raster calculation by rating model]] | ||
| + | The raster layer showing the suitable plot of land uses a rating model to calculate the score of every part of the land. | ||
| + | |||
| + | The purple marked zone is the most suitable land lot to build the structure. The area is scored roughly between 0.65 to 0.8 depending on which part of the area that we're inspecting. The land is roughly 72,000 square metres in area. Thus, there should be enough space to build the new Quarantine Centre. | ||
| − | + | == Sources == | |
| − | 1. [https://data.gov.sg/dataset/master-plan-2014-subzone-boundary-no-sea Master Plan 2014 Subzone (No Sea)] | + | 1. [https://data.gov.sg/dataset/master-plan-2014-subzone-boundary-no-sea Master Plan 2014 Subzone (No Sea)] <br/> |
| − | 2. [https://www.bbbike.org/Singapore/ BBBike@Singapore] | + | 2. [https://www.bbbike.org/Singapore/ BBBike@Singapore]<br/> |
| − | 3. [https://search.earthdata.nasa.gov/search?m=-7.175!25.59375!1!1!0!0%2C2 ASTER Global Digital Elevation Model (GDEM) dataset] | + | 3. [https://search.earthdata.nasa.gov/search?m=-7.175!25.59375!1!1!0!0%2C2 ASTER Global Digital Elevation Model (GDEM) dataset]<br/> |
Latest revision as of 22:18, 10 November 2019
Contents
Part 1: Standard view of study areas
Description
1. Buildings - Classified buildings by color into clinic, construction, garage, place of worship, public, residential, train station, and others.
2. Natural - Classified natural as one single color.
3. Roads - Classified roads into service and track. Any other type of roads were excluded from the study.
4. Elevation - Classified the elevation into colors, representing different heights
Part 2: Raster view of the study areas
Description
1. Buildings - Classified proximity by color. Numbers are in metres.
2. Natural - Classified proximity by color. Numbers are in metres.
3. Roads - Classified proximity by color. Numbers are in metres.
4. Elevation - Classified proximity by color. Numbers are in metres.
Part 3: Raster view showing the criterion scores of the study areas
Description
1. Buildings - Classified proximity by color. Numbers are standardized by reclassifying by table.
2. Natural - Classified proximity by color. Numbers are standardized using reclassifying by table.
3. Roads - Classified proximity by color. Numbers are standardized using reclassifying by table.
4. Elevation - Classified proximity by color. Numbers are standardized using reclassifying by table.
Part 4: AHP tables
Description
1. Health Risk - It is the most important factor to take into consideration as this will affect people staying the area, thus it is scored very highly as compared to the other 3 factors.
2. Accessibility - It is the second most important factor. Accessibility to the site would affect the cost required to transport the construction tools and materials for the new building. Making it cost-effective would be important.
3. Slope angle - As mentioned, slope angle is the third most important factor. Building on steep angle would increase costs of construction and potentially increase the duration of construction. Thus, ensuring the project is finished quickly and cost-effectively would be important.
4. Natural Conservation - it is the least important factor compared to the others. Failure to consider the presence of forests and lakes would endanger the plants and animals in these habitats. However, the costs of these damages are minor compared to the previously mentioned factors. Thus, it's score is relatively low compared to the rest.
Part 5: Suitable land
Discussion
The raster layer showing the suitable plot of land uses a rating model to calculate the score of every part of the land.
The purple marked zone is the most suitable land lot to build the structure. The area is scored roughly between 0.65 to 0.8 depending on which part of the area that we're inspecting. The land is roughly 72,000 square metres in area. Thus, there should be enough space to build the new Quarantine Centre.
Sources
1. Master Plan 2014 Subzone (No Sea)
2. BBBike@Singapore
3. ASTER Global Digital Elevation Model (GDEM) dataset


