Difference between revisions of "SMT201 AY2019-20T1 EX2 Tan Zi Ying"
Zy.tan.2018 (talk | contribs) |
Zy.tan.2018 (talk | contribs) |
||
| Line 54: | Line 54: | ||
== Criterion Scores of each Factor Layers == | == Criterion Scores of each Factor Layers == | ||
| + | In order to compare the criterion scores of the respective factor layers, I standardized the proximity analysis result as shown. | ||
[[ File:standard1.png|500px|center|AHP_input_maxtrix]] | [[ File:standard1.png|500px|center|AHP_input_maxtrix]] | ||
<br/> | <br/> | ||
| + | For the road and natural factor layer I used the formula (1-(proximity)/(max(proximity)-min(proximity))) | ||
[[ File:standard2.png|500px|center|AHP_input_maxtrix]] | [[ File:standard2.png|500px|center|AHP_input_maxtrix]] | ||
| + | For the slope and building factor layer I used the formula (proximity)/(max(proximity)-min(proximity)) | ||
<br/> | <br/> | ||
[[ File:criteria_tzy.png|900px|center|AHP_criterion]] | [[ File:criteria_tzy.png|900px|center|AHP_criterion]] | ||
<br/> | <br/> | ||
| + | The criterion score ranges from 0 to 1, the darker areas represent area with a higher criterion score while the lighter areas represent area with a lower criterion score. | ||
== Analytical Hierarchical Process Input Matrix and Result Report == | == Analytical Hierarchical Process Input Matrix and Result Report == | ||
Revision as of 22:09, 10 November 2019
Contents
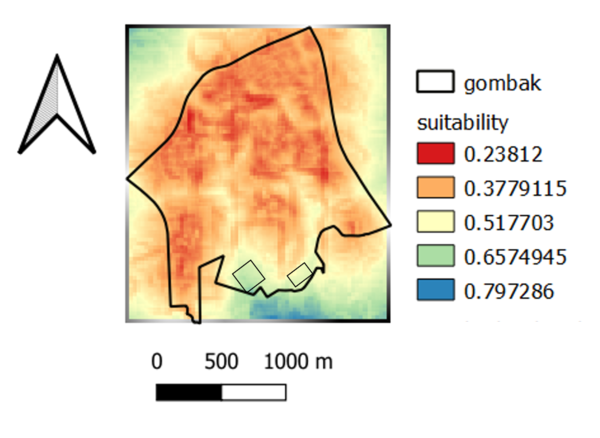
Building a national Communicable Disease Quarantine Centre
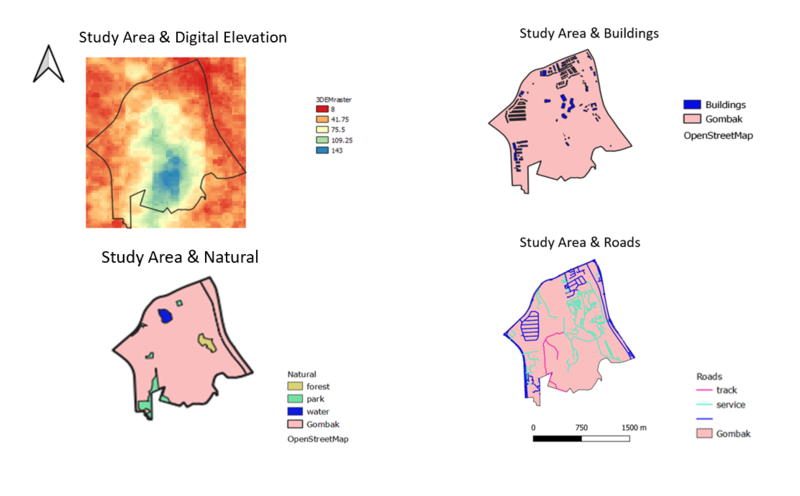
- Economic Factor (study area and digital elevation)
- Accessibility Factor (study area and target roads)
- Health Risk Factor (study area and buildings)
- Natural Conservation Factor (study area and natural)
Data source: Master Plan 2014 Subzone Boundary from URA from data.gov.sg.
Roads, buildings and natural features data from OpenStreetMap (OSM) data sets from BBBike@Singapore.
ASTER Global Digital Elevation Model (GDEM) dataset jointly prepared by NASA and METI, Japan from NASA’s EarthData Search site complied by Professor Kam
Economic factor
The selected site should avoid steep slope. This is because construction at steep slope tends to involve a lot of cut-and-fill and will lend to relatively higher development cost. The lowest point in Gombak, depicted in red is 8 meters above sea level while the highest point in Gombak, depicted in blue is 143 meters above sea level.
Accessibility factor
The selected site should be close to existing local roads, namely: service roads and tracks. This is to ensure easy transportation of building materials during the construction stage. As seen in the data, there is more service roads in the North-East of Gombak and the tracks are in the South-West of Gombak.
Health risk factor
The selected site should be away from population i.e. housing areas and offices in order to avoid disease spreading to the nearby population. The buildings are mostly in the North and South part of Gombak.
Natural conservation factor
The selected site should be away from forested land, park and water. The water body is depicted in blue, the park in green and the forest is in mustard yellow.
Proximity Analysis
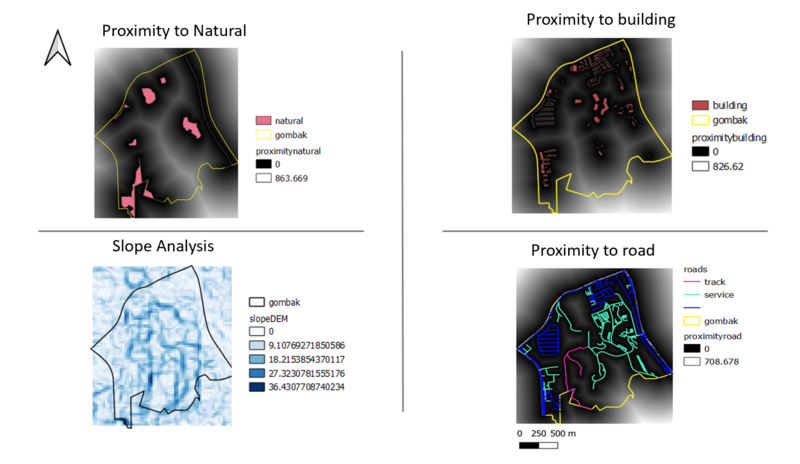
- the study area and proximity to target roads layer
- the study area and proximity to buildings layer
- the study area and proximity to target natural features layer
- the study area and slope layer
Data source: Master Plan 2014 Subzone Boundary from URA from data.gov.sg. Roads, buildings and natural features data from OpenStreetMap (OSM) data sets from BBBike@Singapore. ASTER Global Digital Elevation Model (GDEM) dataset jointly prepared by NASA and METI, Japan from NASA’s EarthData Search site complied by Professor Kam
Proximity to Nature
The areas in black are closer to nature features and not as preferred as the areas in white that are further away from the natural features. The furthest distance away from natural in this map is 863.669 meters. The Quarantine Centre should be build as far away from natural features as possible.
Proximity to Roads
The areas in black are closer to the roads and hence it more preferred. The closer the Quarantine Centre to the Road, the more accessible it is. Therefore, it is more suited to build the Quarantine Centre in closer proximity to the service roads and tracks.
Proximity to Buildings
The areas in black are closer to the buildings. Hence it would be less suitable to build the Quarantine Centre in these areas as it is too close to the population in Gombak. The furthest distance from the buildings is 826.62 meters.
Slopes
The areas in darker blue are used to shade the areas with slopes higher than 30 degrees. Hence, it would be less suited to build the Quarantine Centre in the areas of darker shades as is too steep to build the Quarantine Centre. The steepest area in Gombak is 36.43 degrees.
Criterion Scores of each Factor Layers
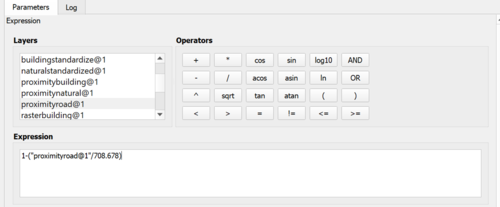
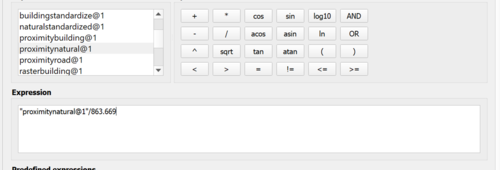
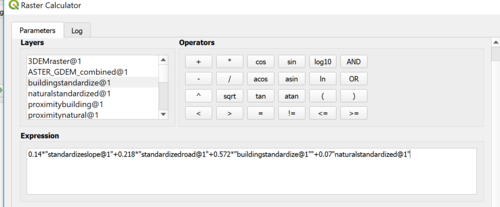
In order to compare the criterion scores of the respective factor layers, I standardized the proximity analysis result as shown.
For the road and natural factor layer I used the formula (1-(proximity)/(max(proximity)-min(proximity)))
For the slope and building factor layer I used the formula (proximity)/(max(proximity)-min(proximity))
The criterion score ranges from 0 to 1, the darker areas represent area with a higher criterion score while the lighter areas represent area with a lower criterion score.
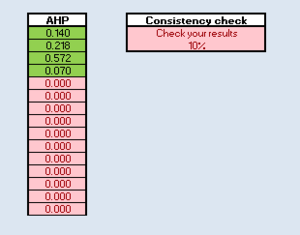
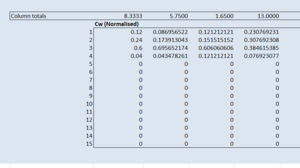
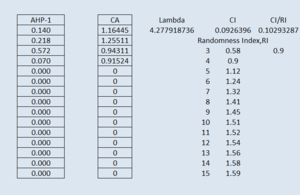
Analytical Hierarchical Process Input Matrix and Result Report
Data Source: AHP Template from SCBUK
Data Source: AHP Template from SCBUK
Data Source: AHP Template from SCBUK
Data Source: AHP Template from SCBUK
Comments on the Suitable Land Lot(s) Identified
