File list
Jump to navigation
Jump to search
This special page shows all uploaded files.
| Date | Name | Thumbnail | Size | User | Description | Versions |
|---|---|---|---|---|---|---|
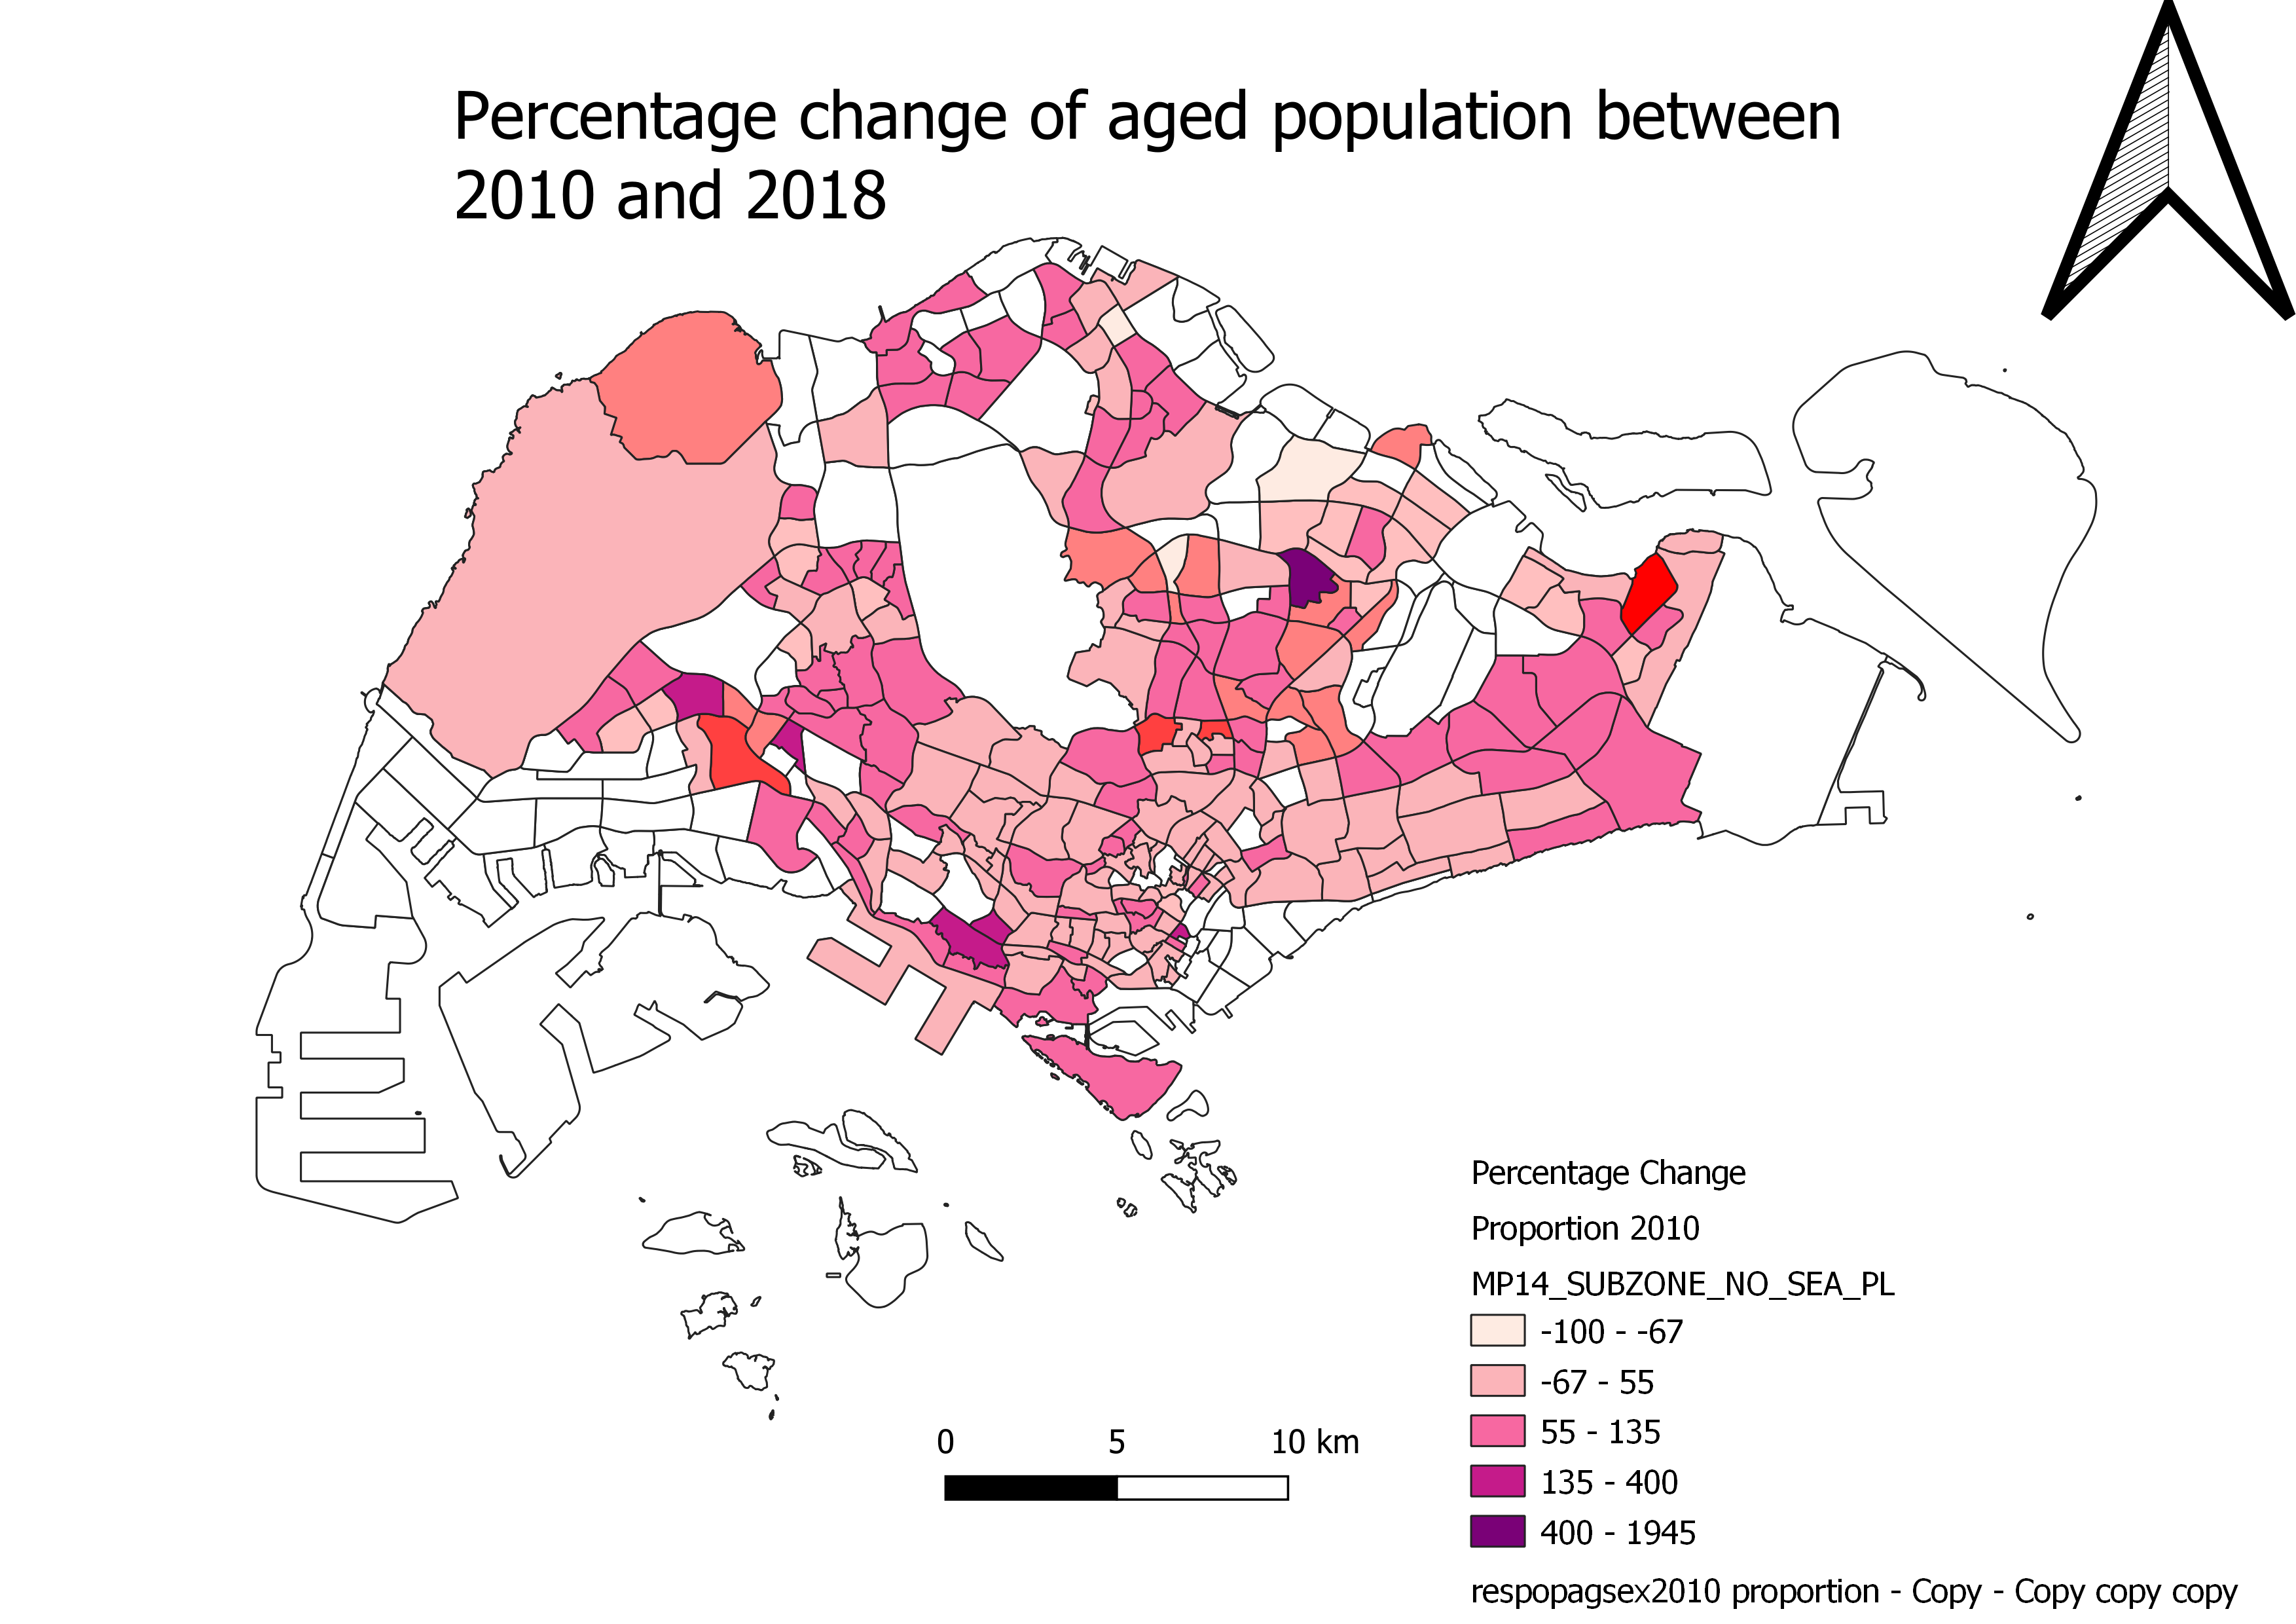
| 15:17, 15 September 2019 | PercentageChangeBetween2010and2018.png (file) |  |
667 KB | Brendan.ong.2018 | 1 | |
| 15:22, 15 September 2019 | PEI Christine.png (file) |  |
222 KB | Jttan.2018 | 1 | |
| 15:24, 15 September 2019 | Q2 Part 1a.png (file) |  |
881 KB | Jolene.pek.2018 | 1 | |
| 15:24, 15 September 2019 | Q2 Part 1b.png (file) |  |
993 KB | Jolene.pek.2018 | 1 | |
| 15:27, 15 September 2019 | Q2 Part 2a.png (file) |  |
1.05 MB | Jolene.pek.2018 | 1 | |
| 15:28, 15 September 2019 | Q2 Part 2b.png (file) |  |
1.07 MB | Jolene.pek.2018 | 1 | |
| 15:28, 15 September 2019 | Q2 Part 3.png (file) |  |
1 MB | Jolene.pek.2018 | 1 | |
| 15:29, 15 September 2019 | RoadNetwork Christine .png (file) |  |
307 KB | Jttan.2018 | 1 | |
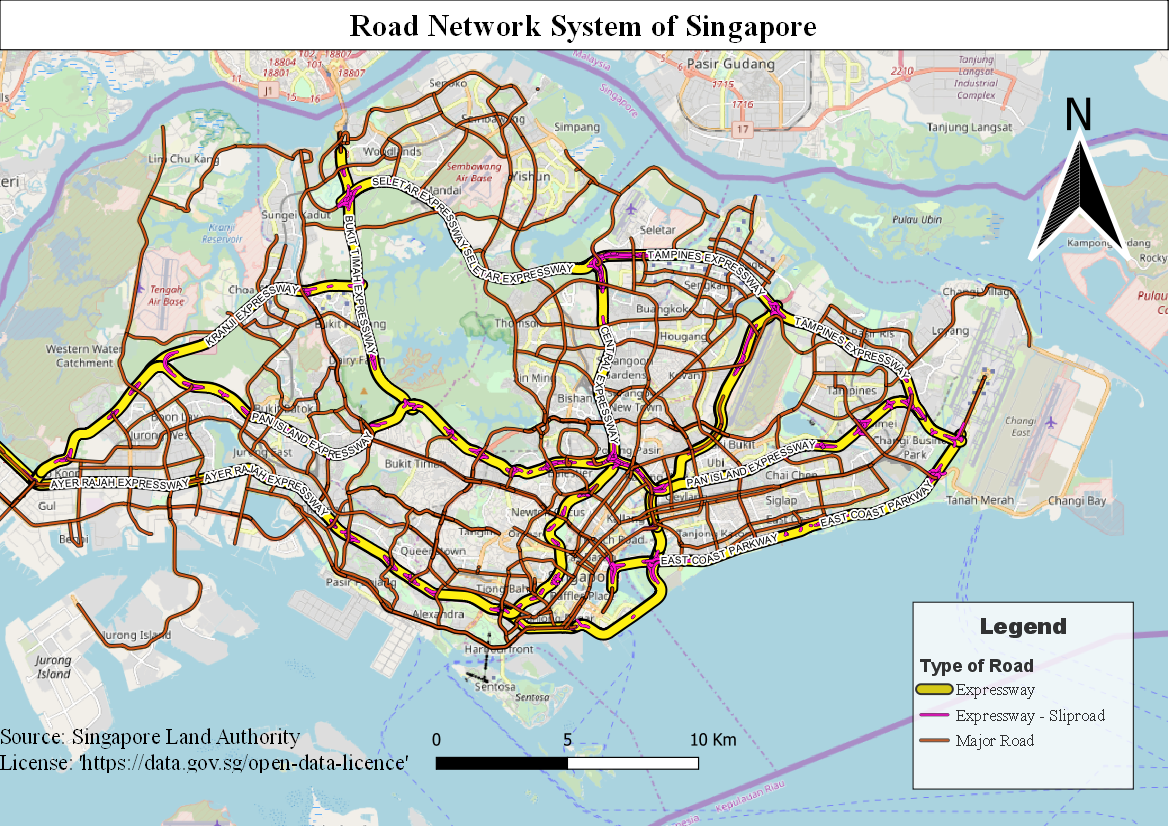
| 15:36, 15 September 2019 | Road Network System of Singapore.png (file) |  |
1.08 MB | Jerome.quah.2018 | 2 | |
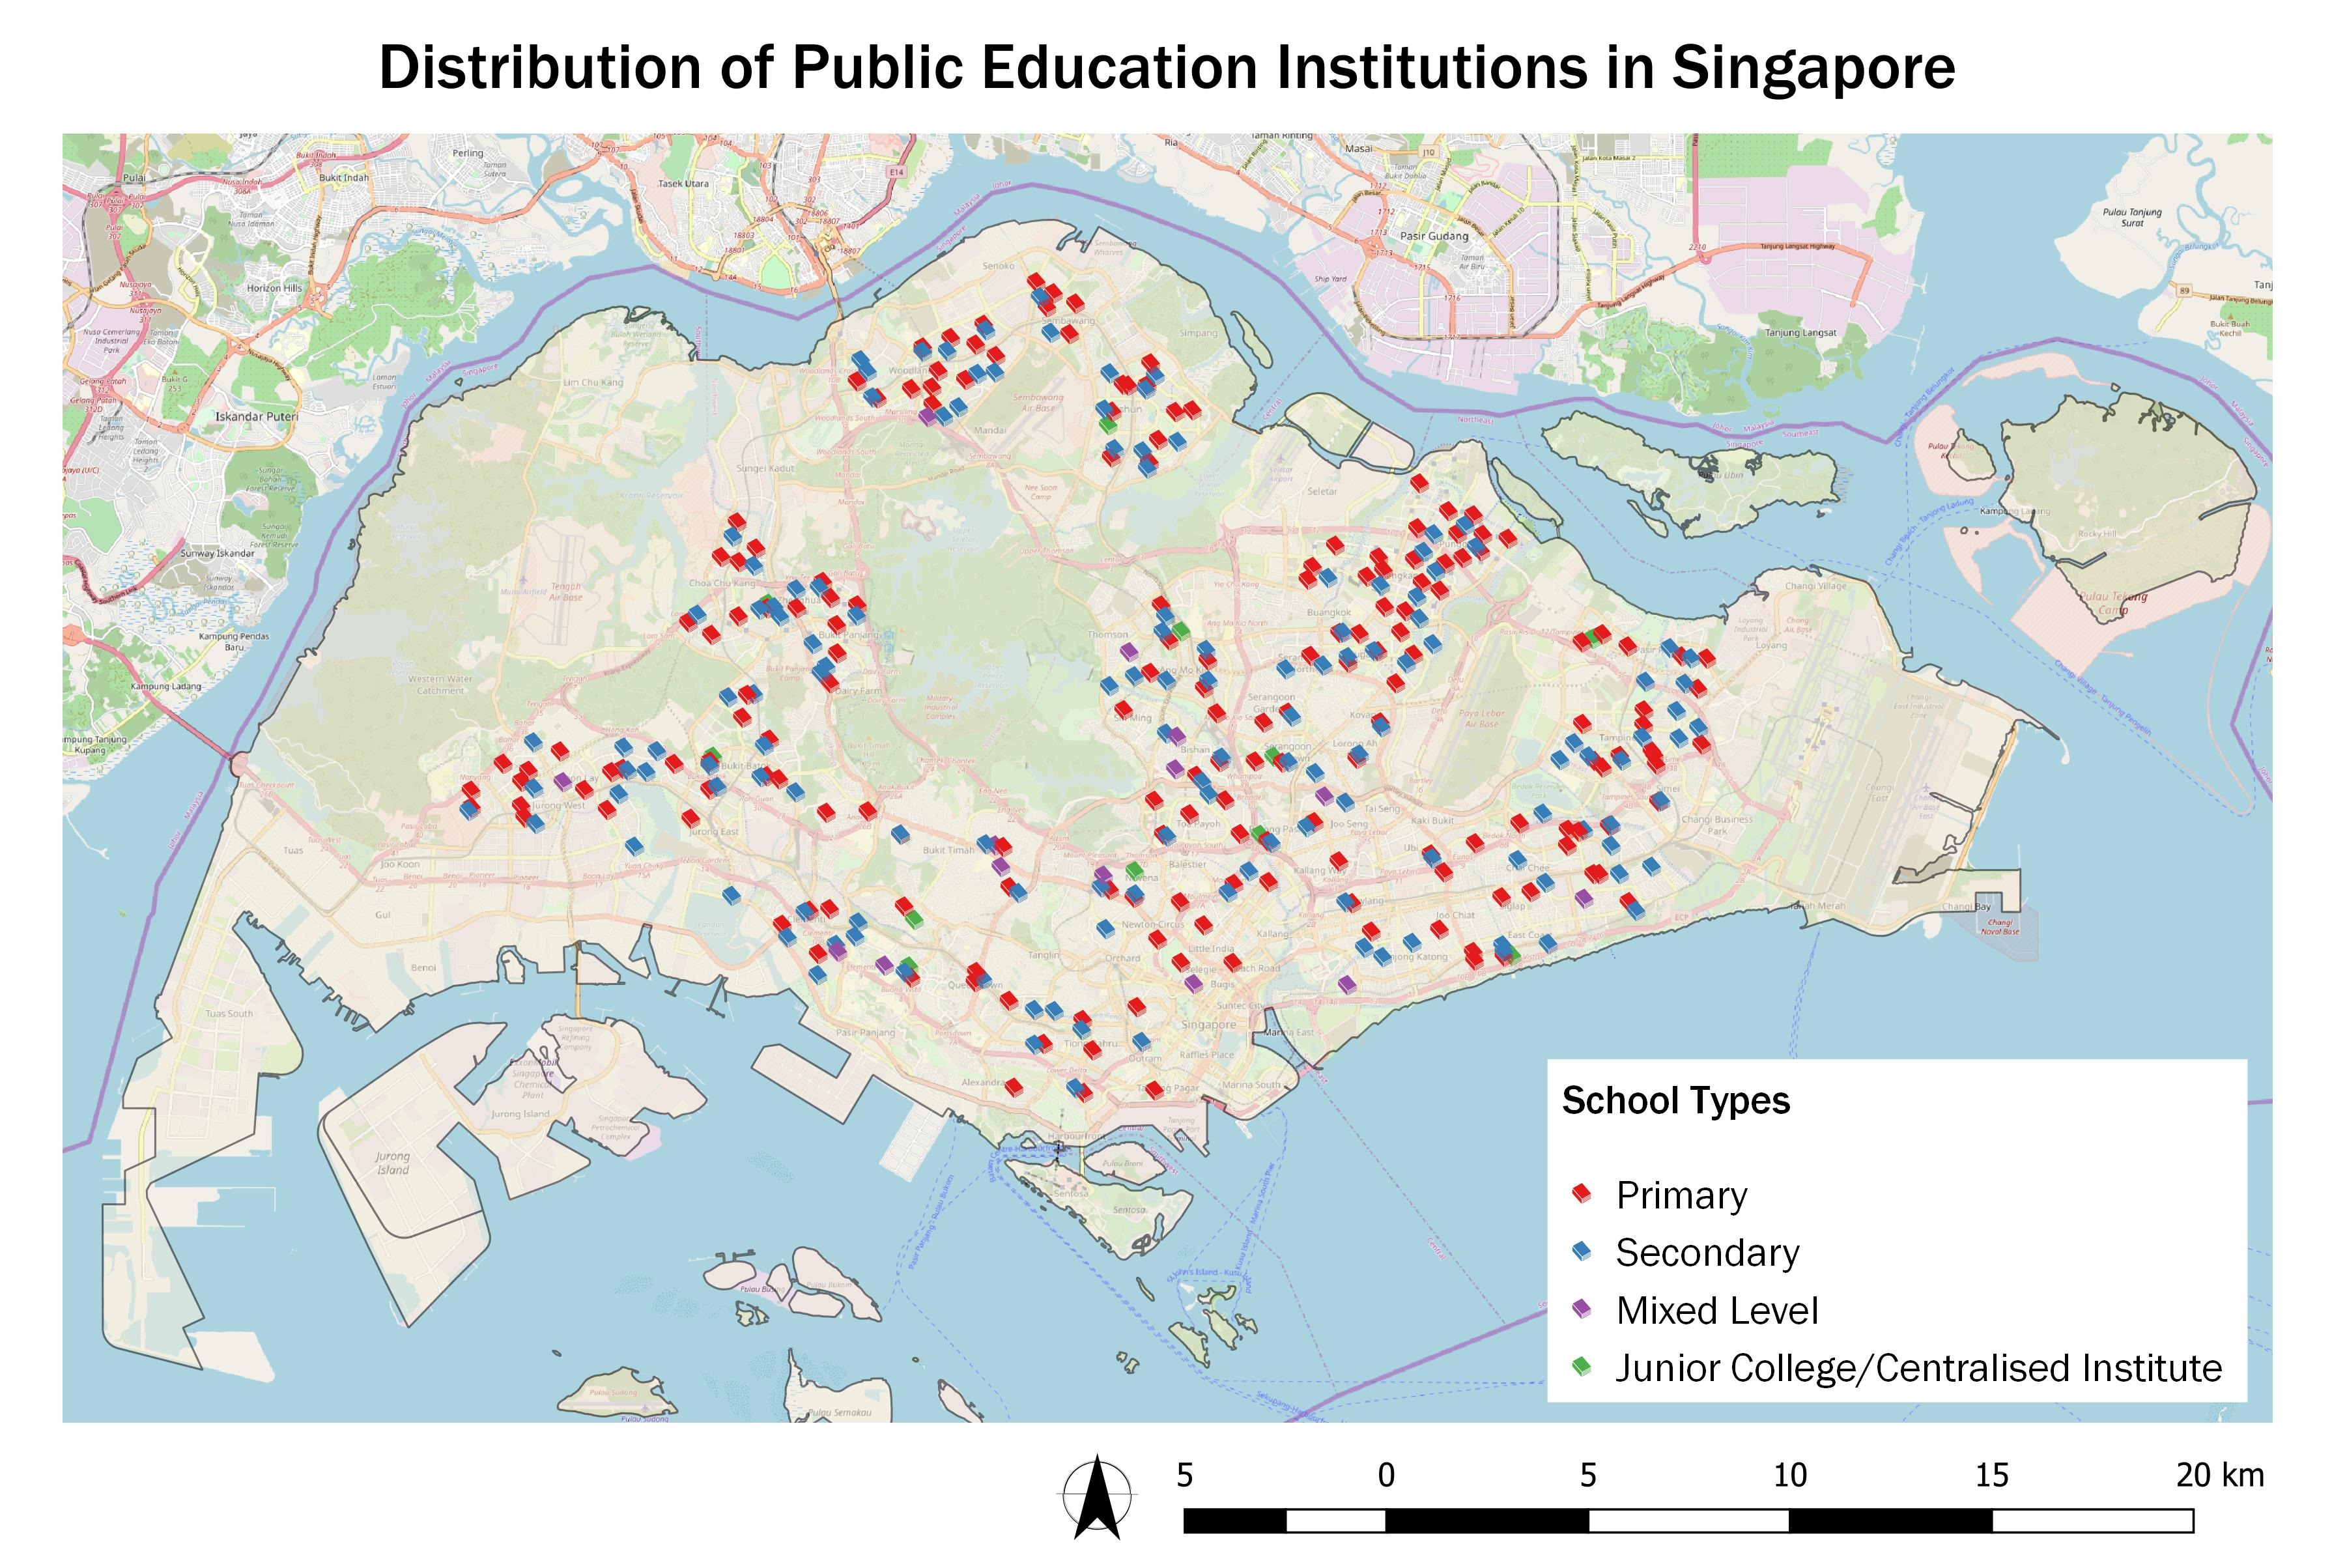
| 15:39, 15 September 2019 | P1a-schooldistribution.jpg (file) |  |
1.51 MB | Baihe.soh.2018 | 2 | |
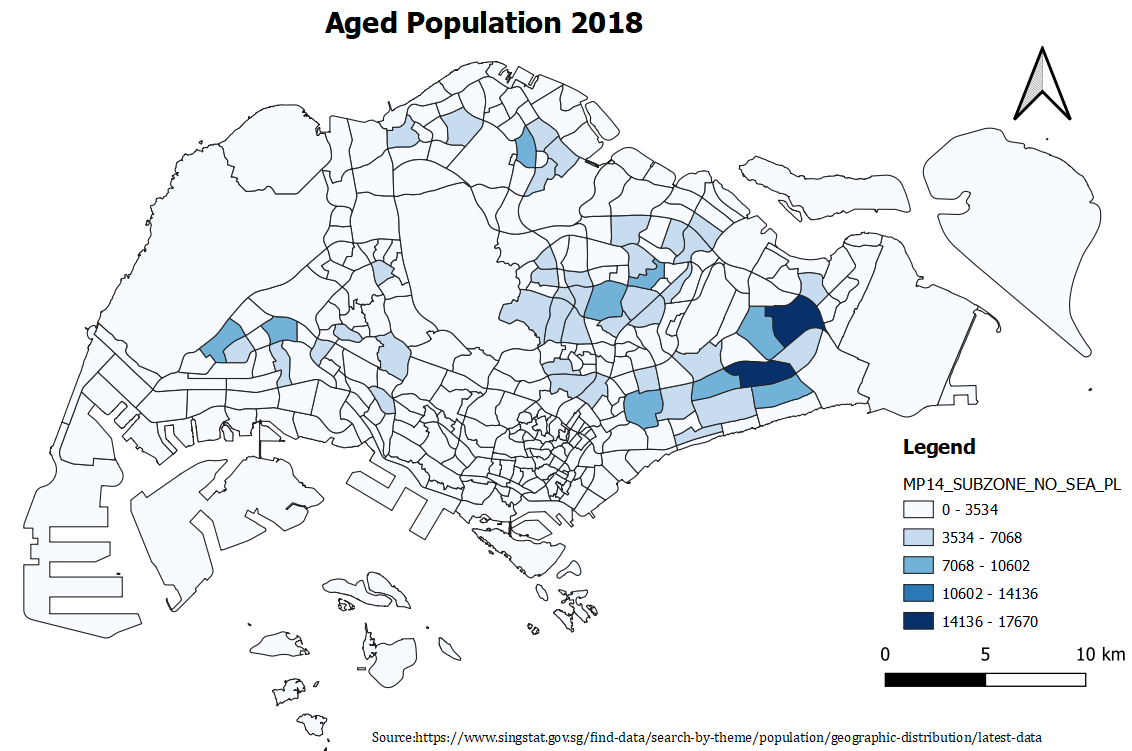
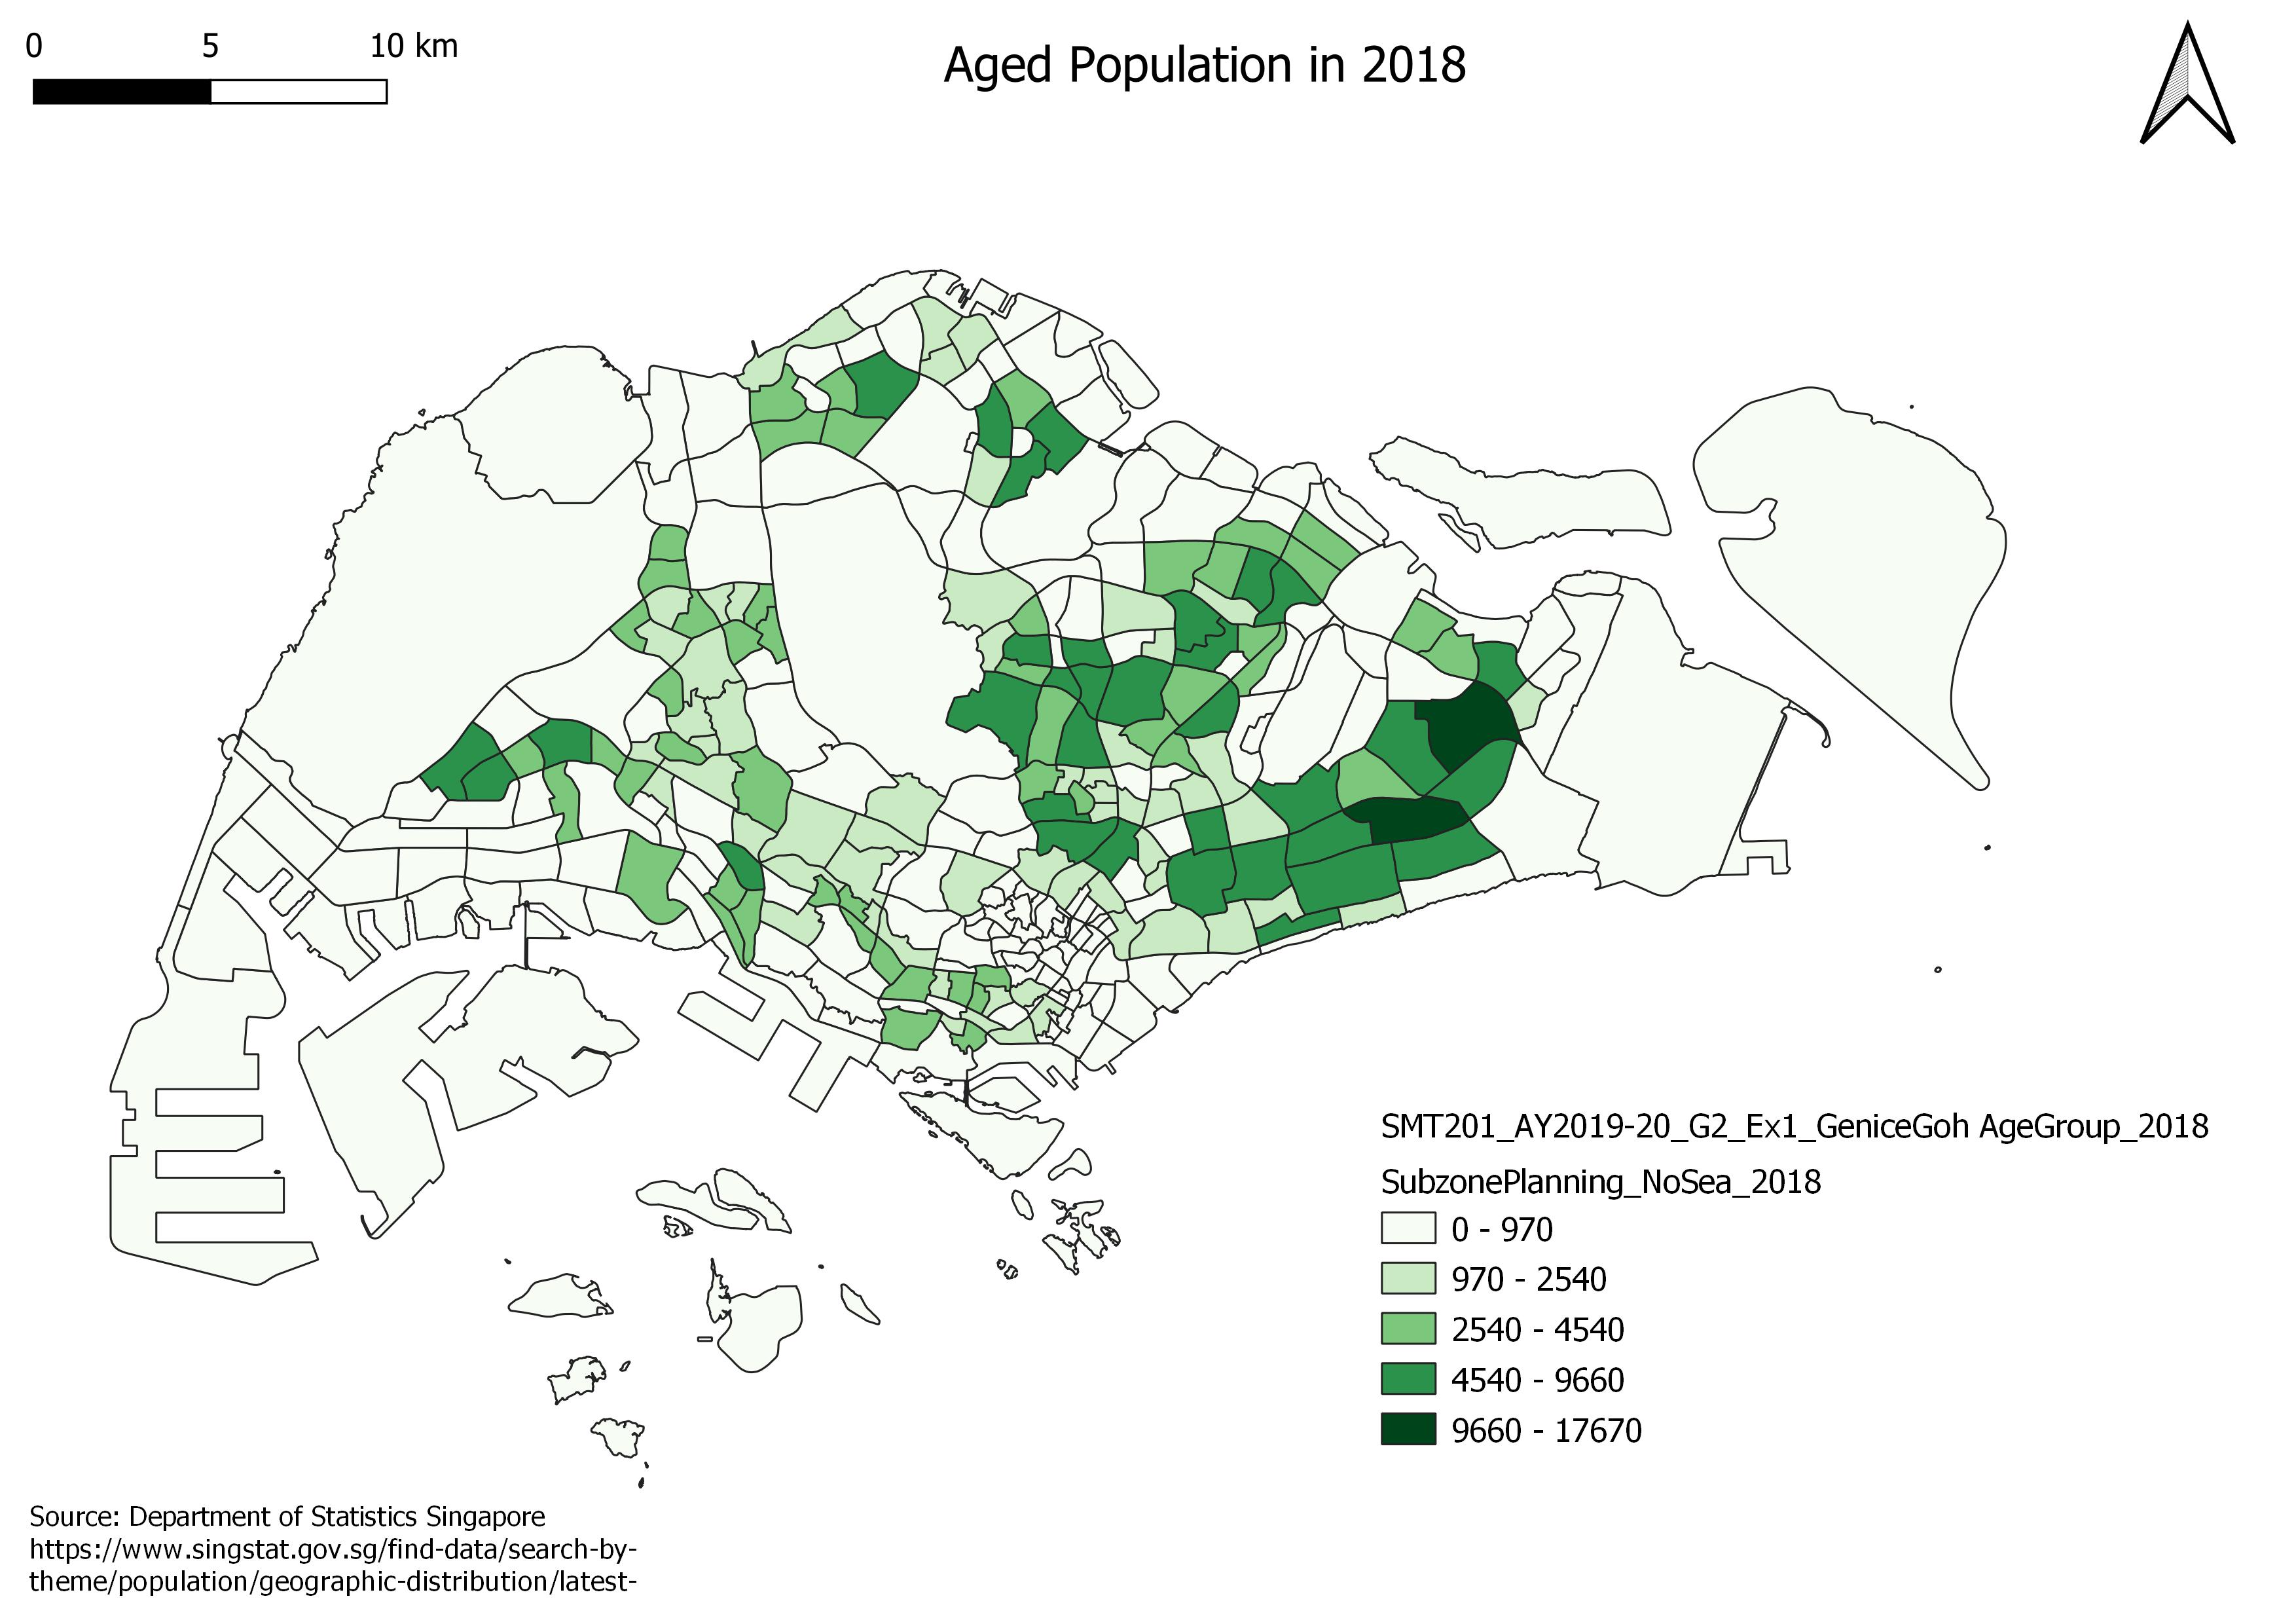
| 15:40, 15 September 2019 | Aged population 2018.png (file) |  |
197 KB | Yu.zang.2016 | 1 | |
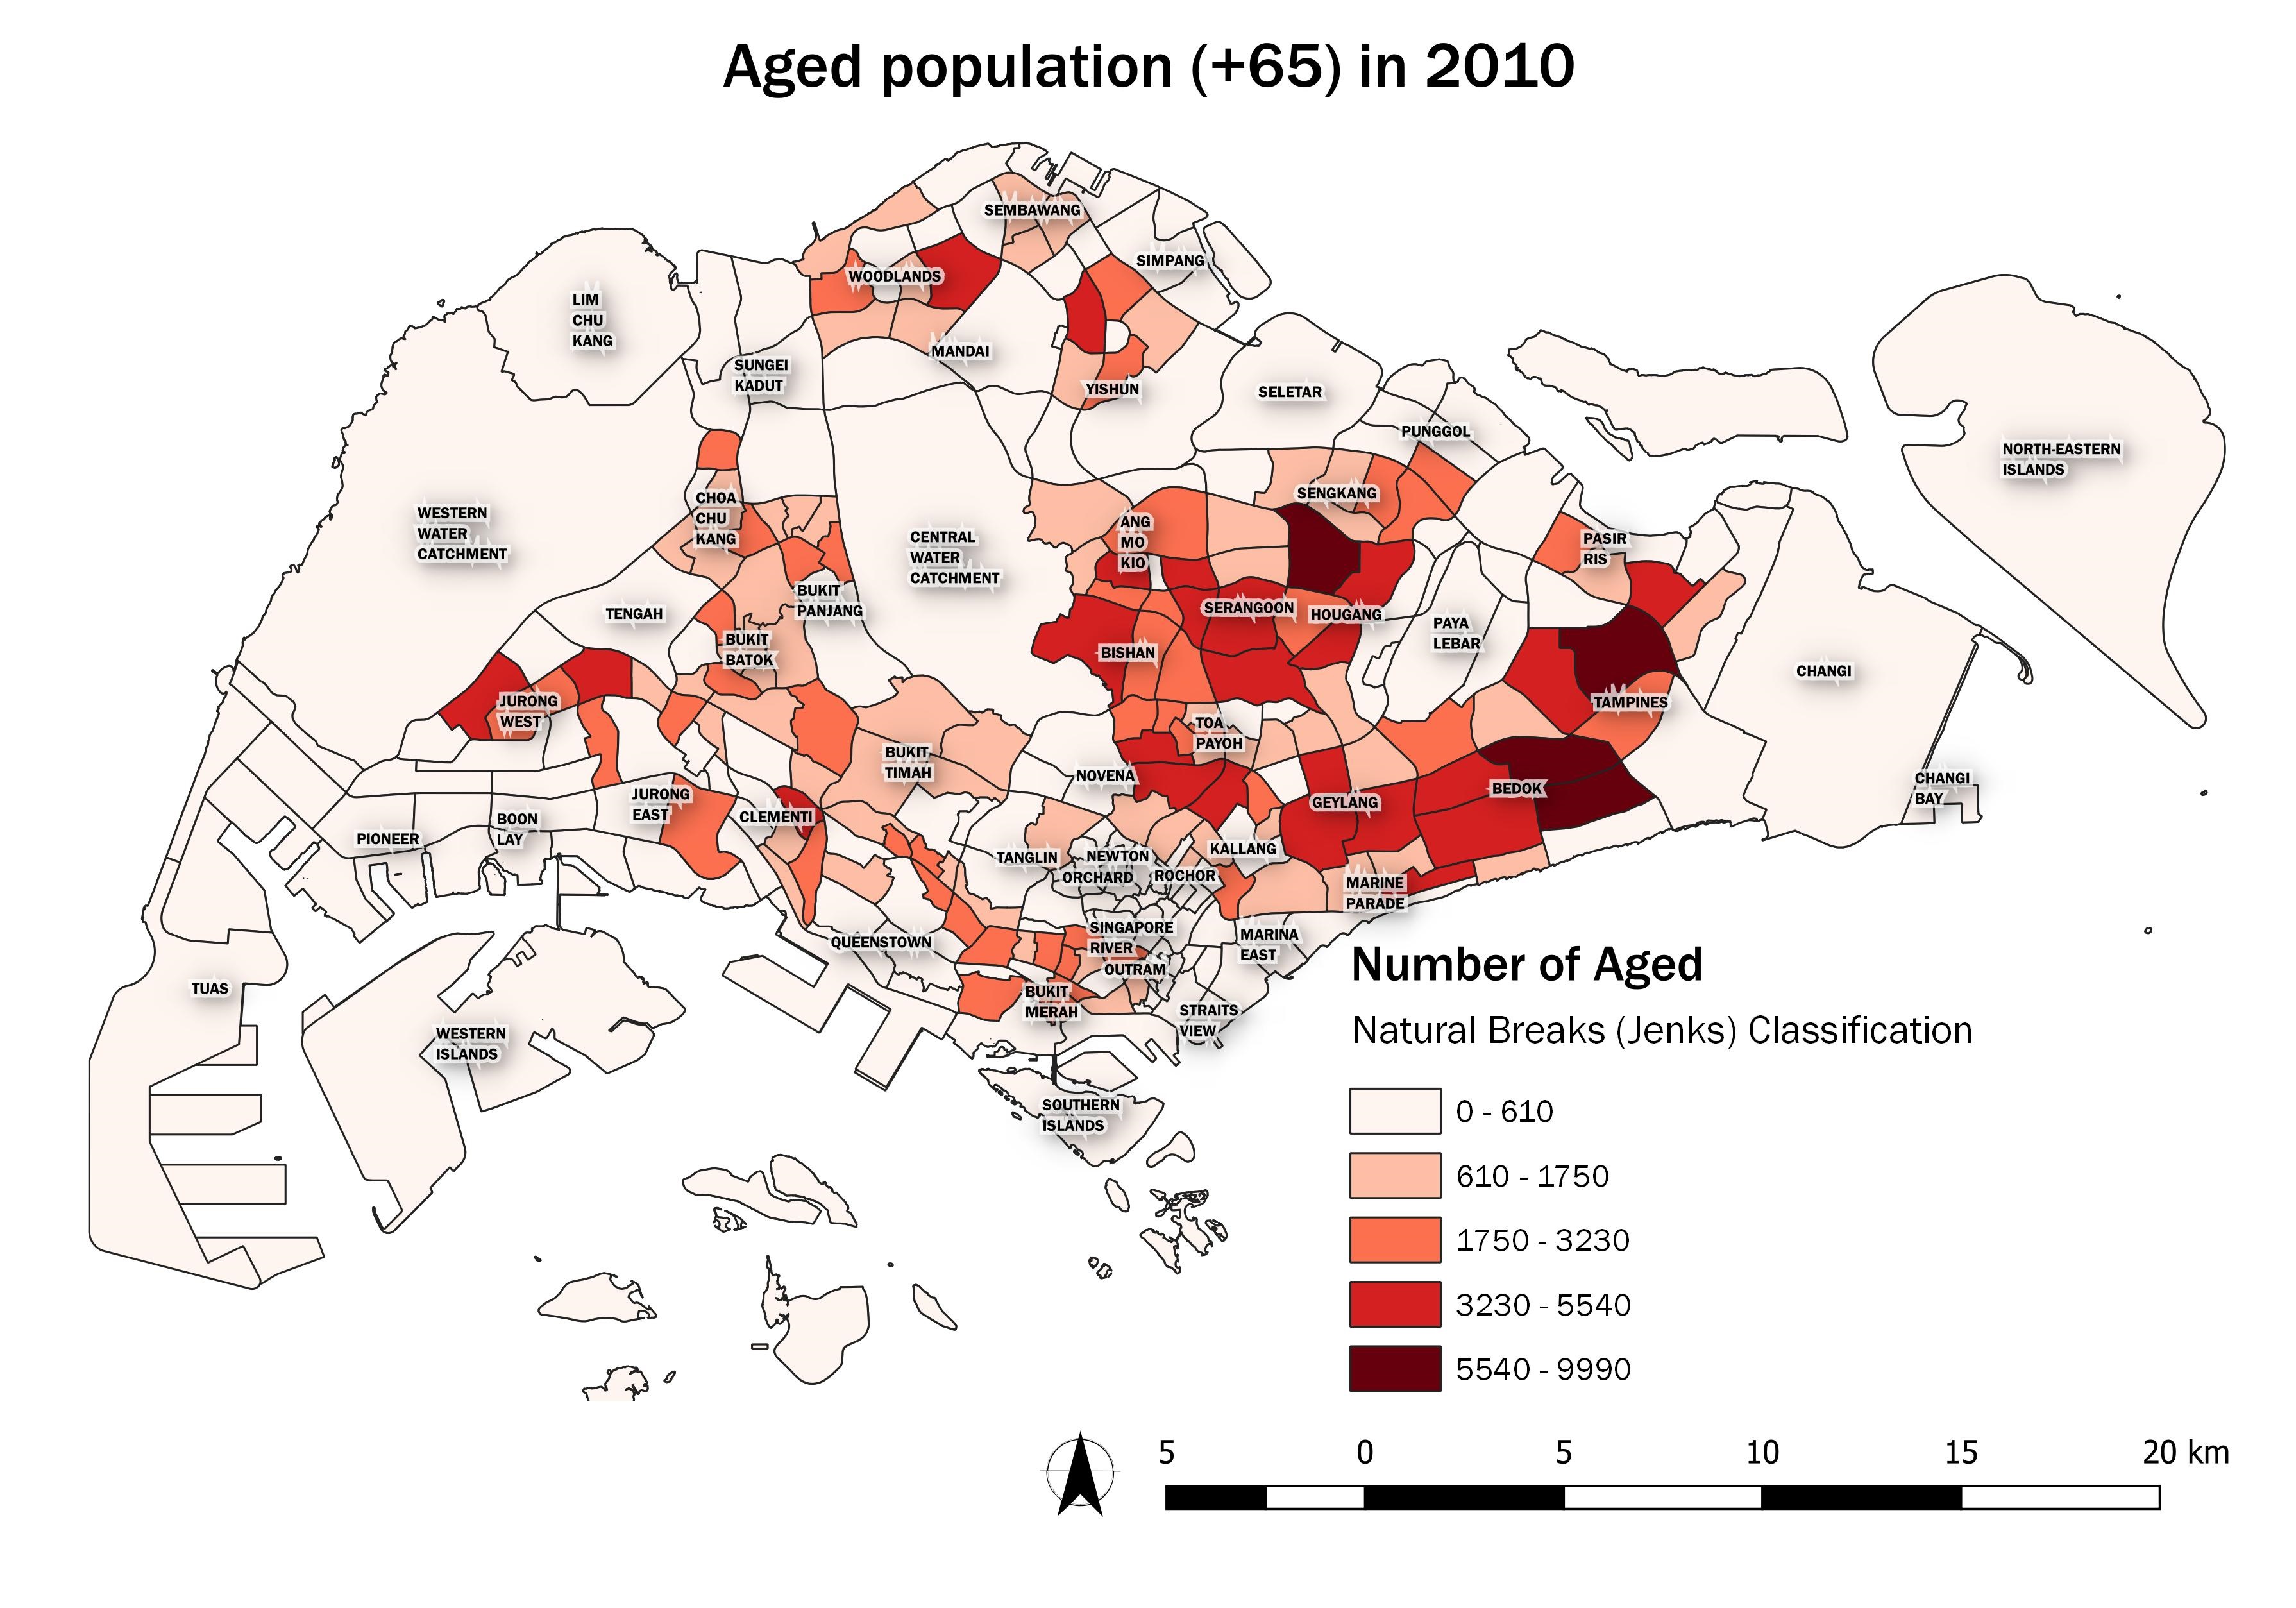
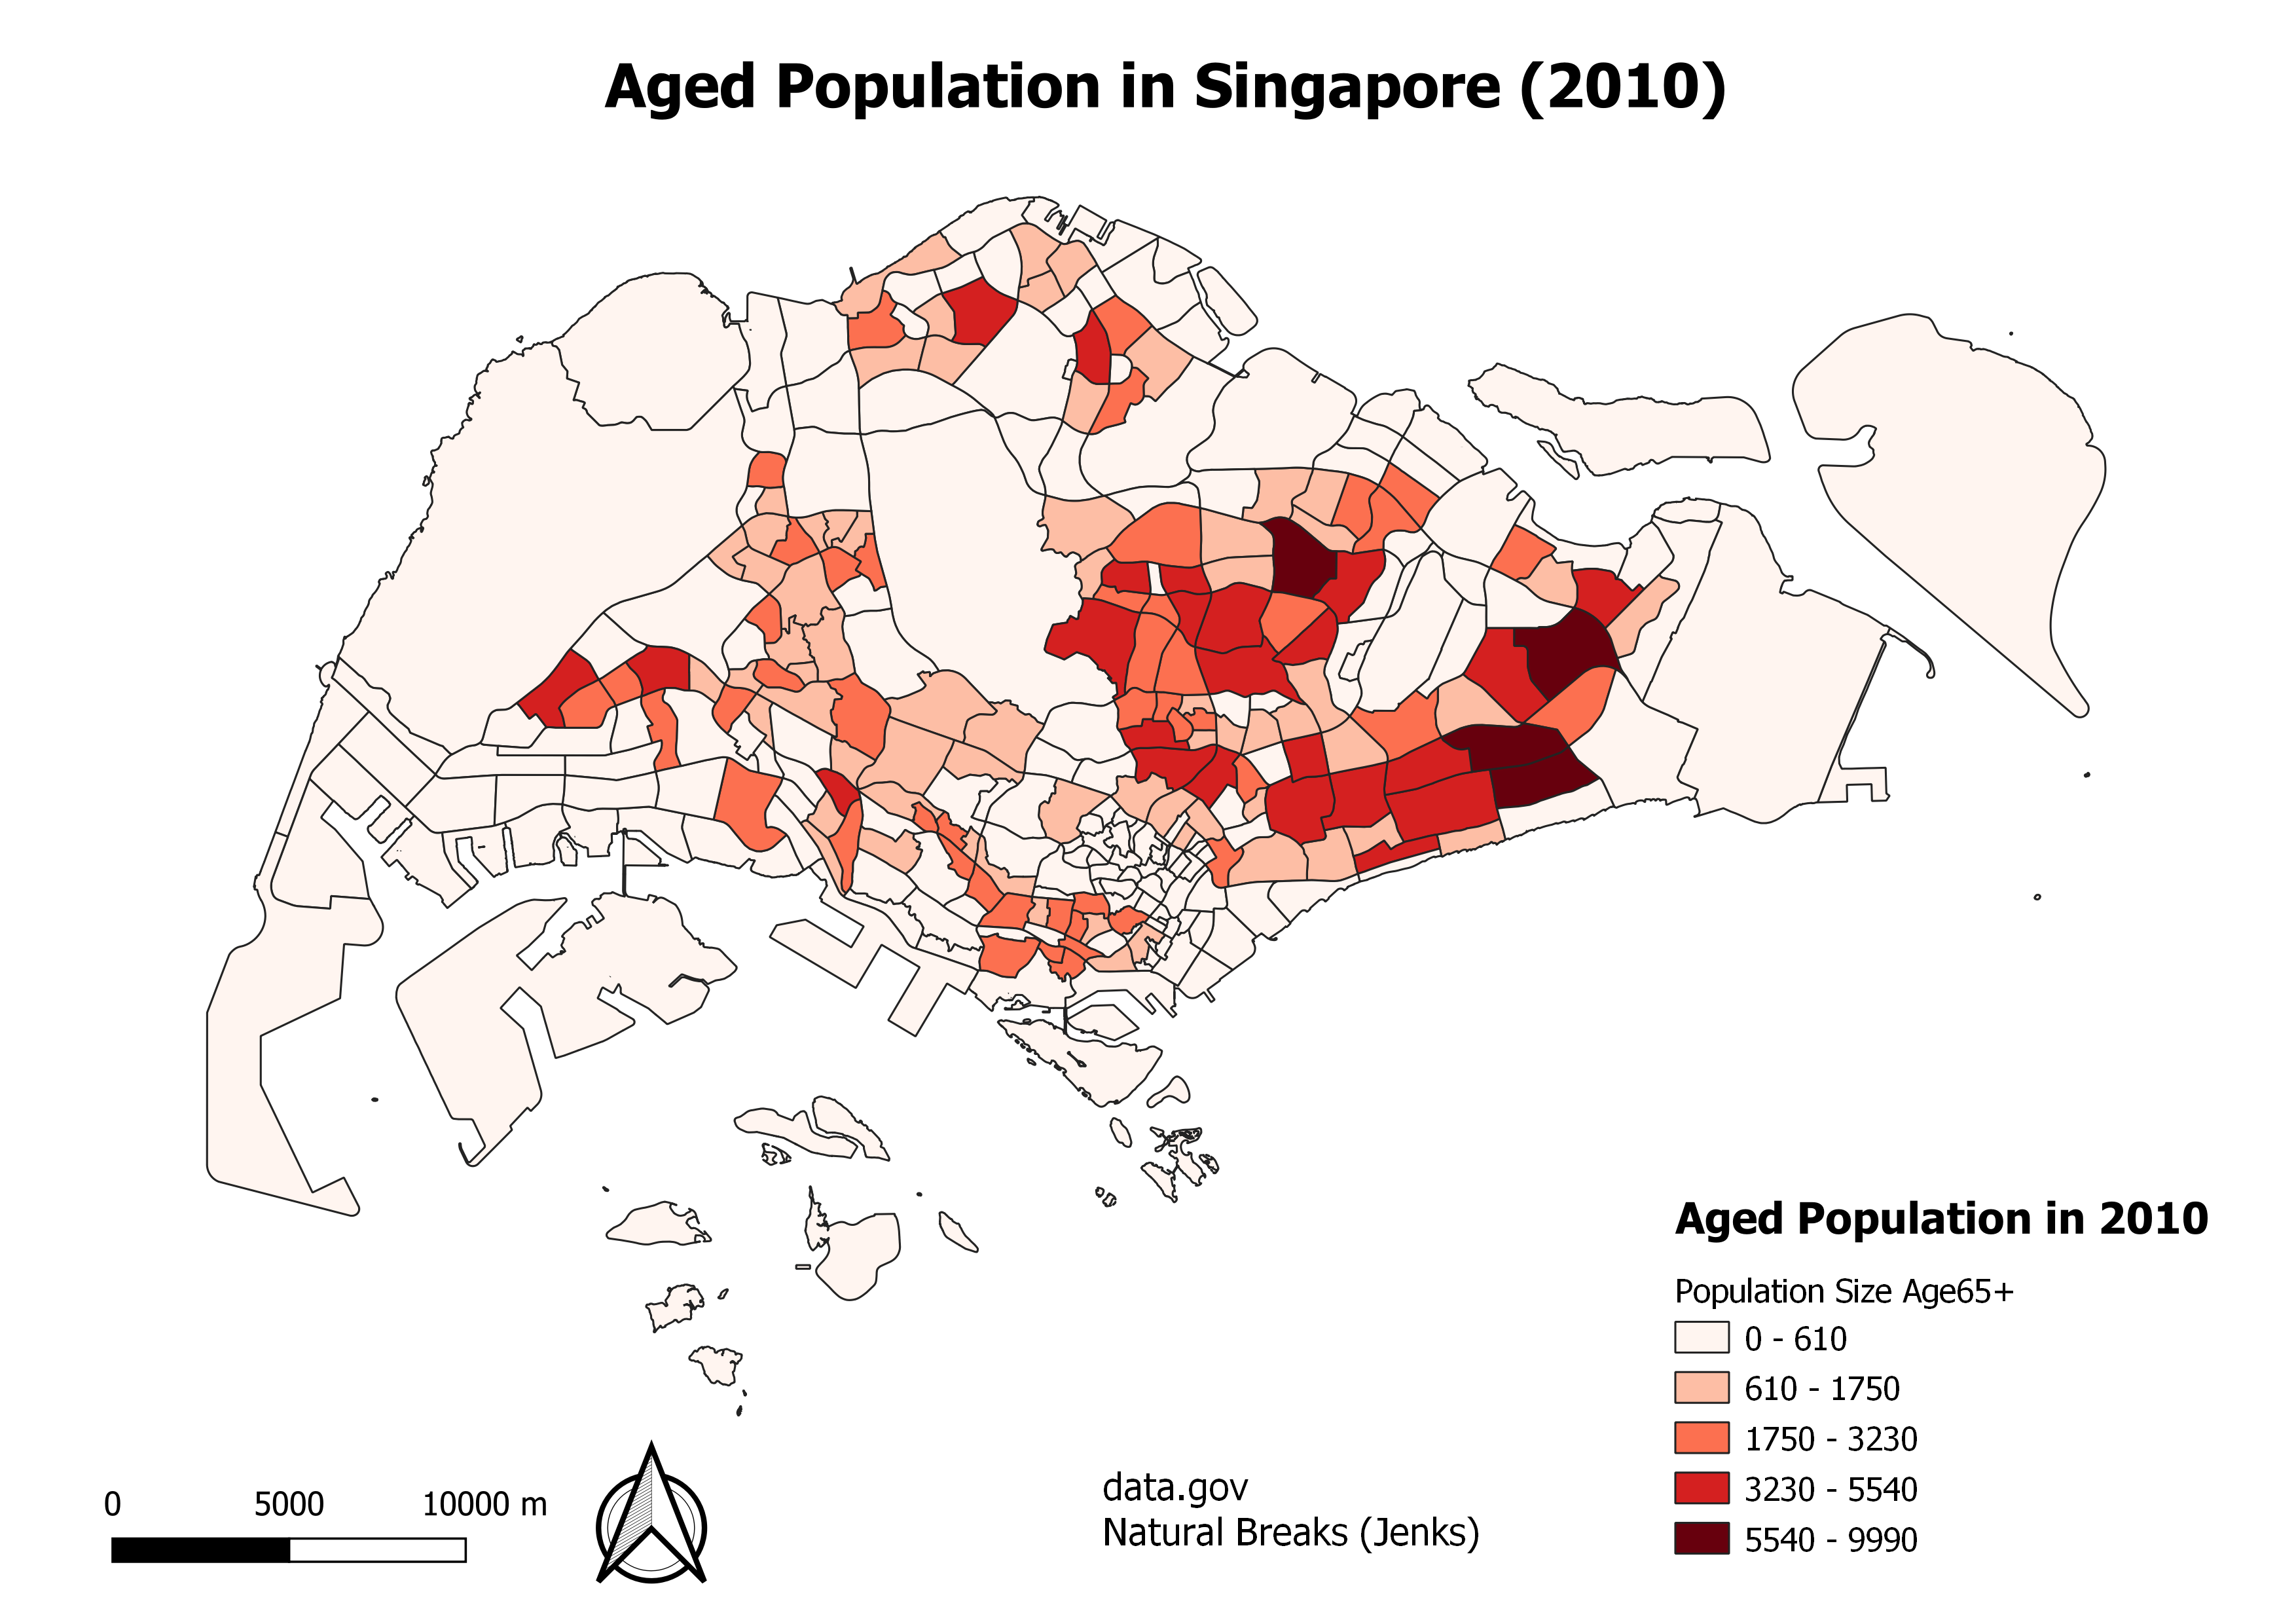
| 15:40, 15 September 2019 | Aged65 in 2010.jpg (file) |  |
525 KB | Genice.goh.2018 | 1 | |
| 15:41, 15 September 2019 | Age65+ 2010 and 2018.png (file) |  |
536 KB | Bcheng.2018 | 1 | |
| 15:44, 15 September 2019 | P1b-roadnetwork.jpg (file) |  |
1.84 MB | Baihe.soh.2018 | 2 | |
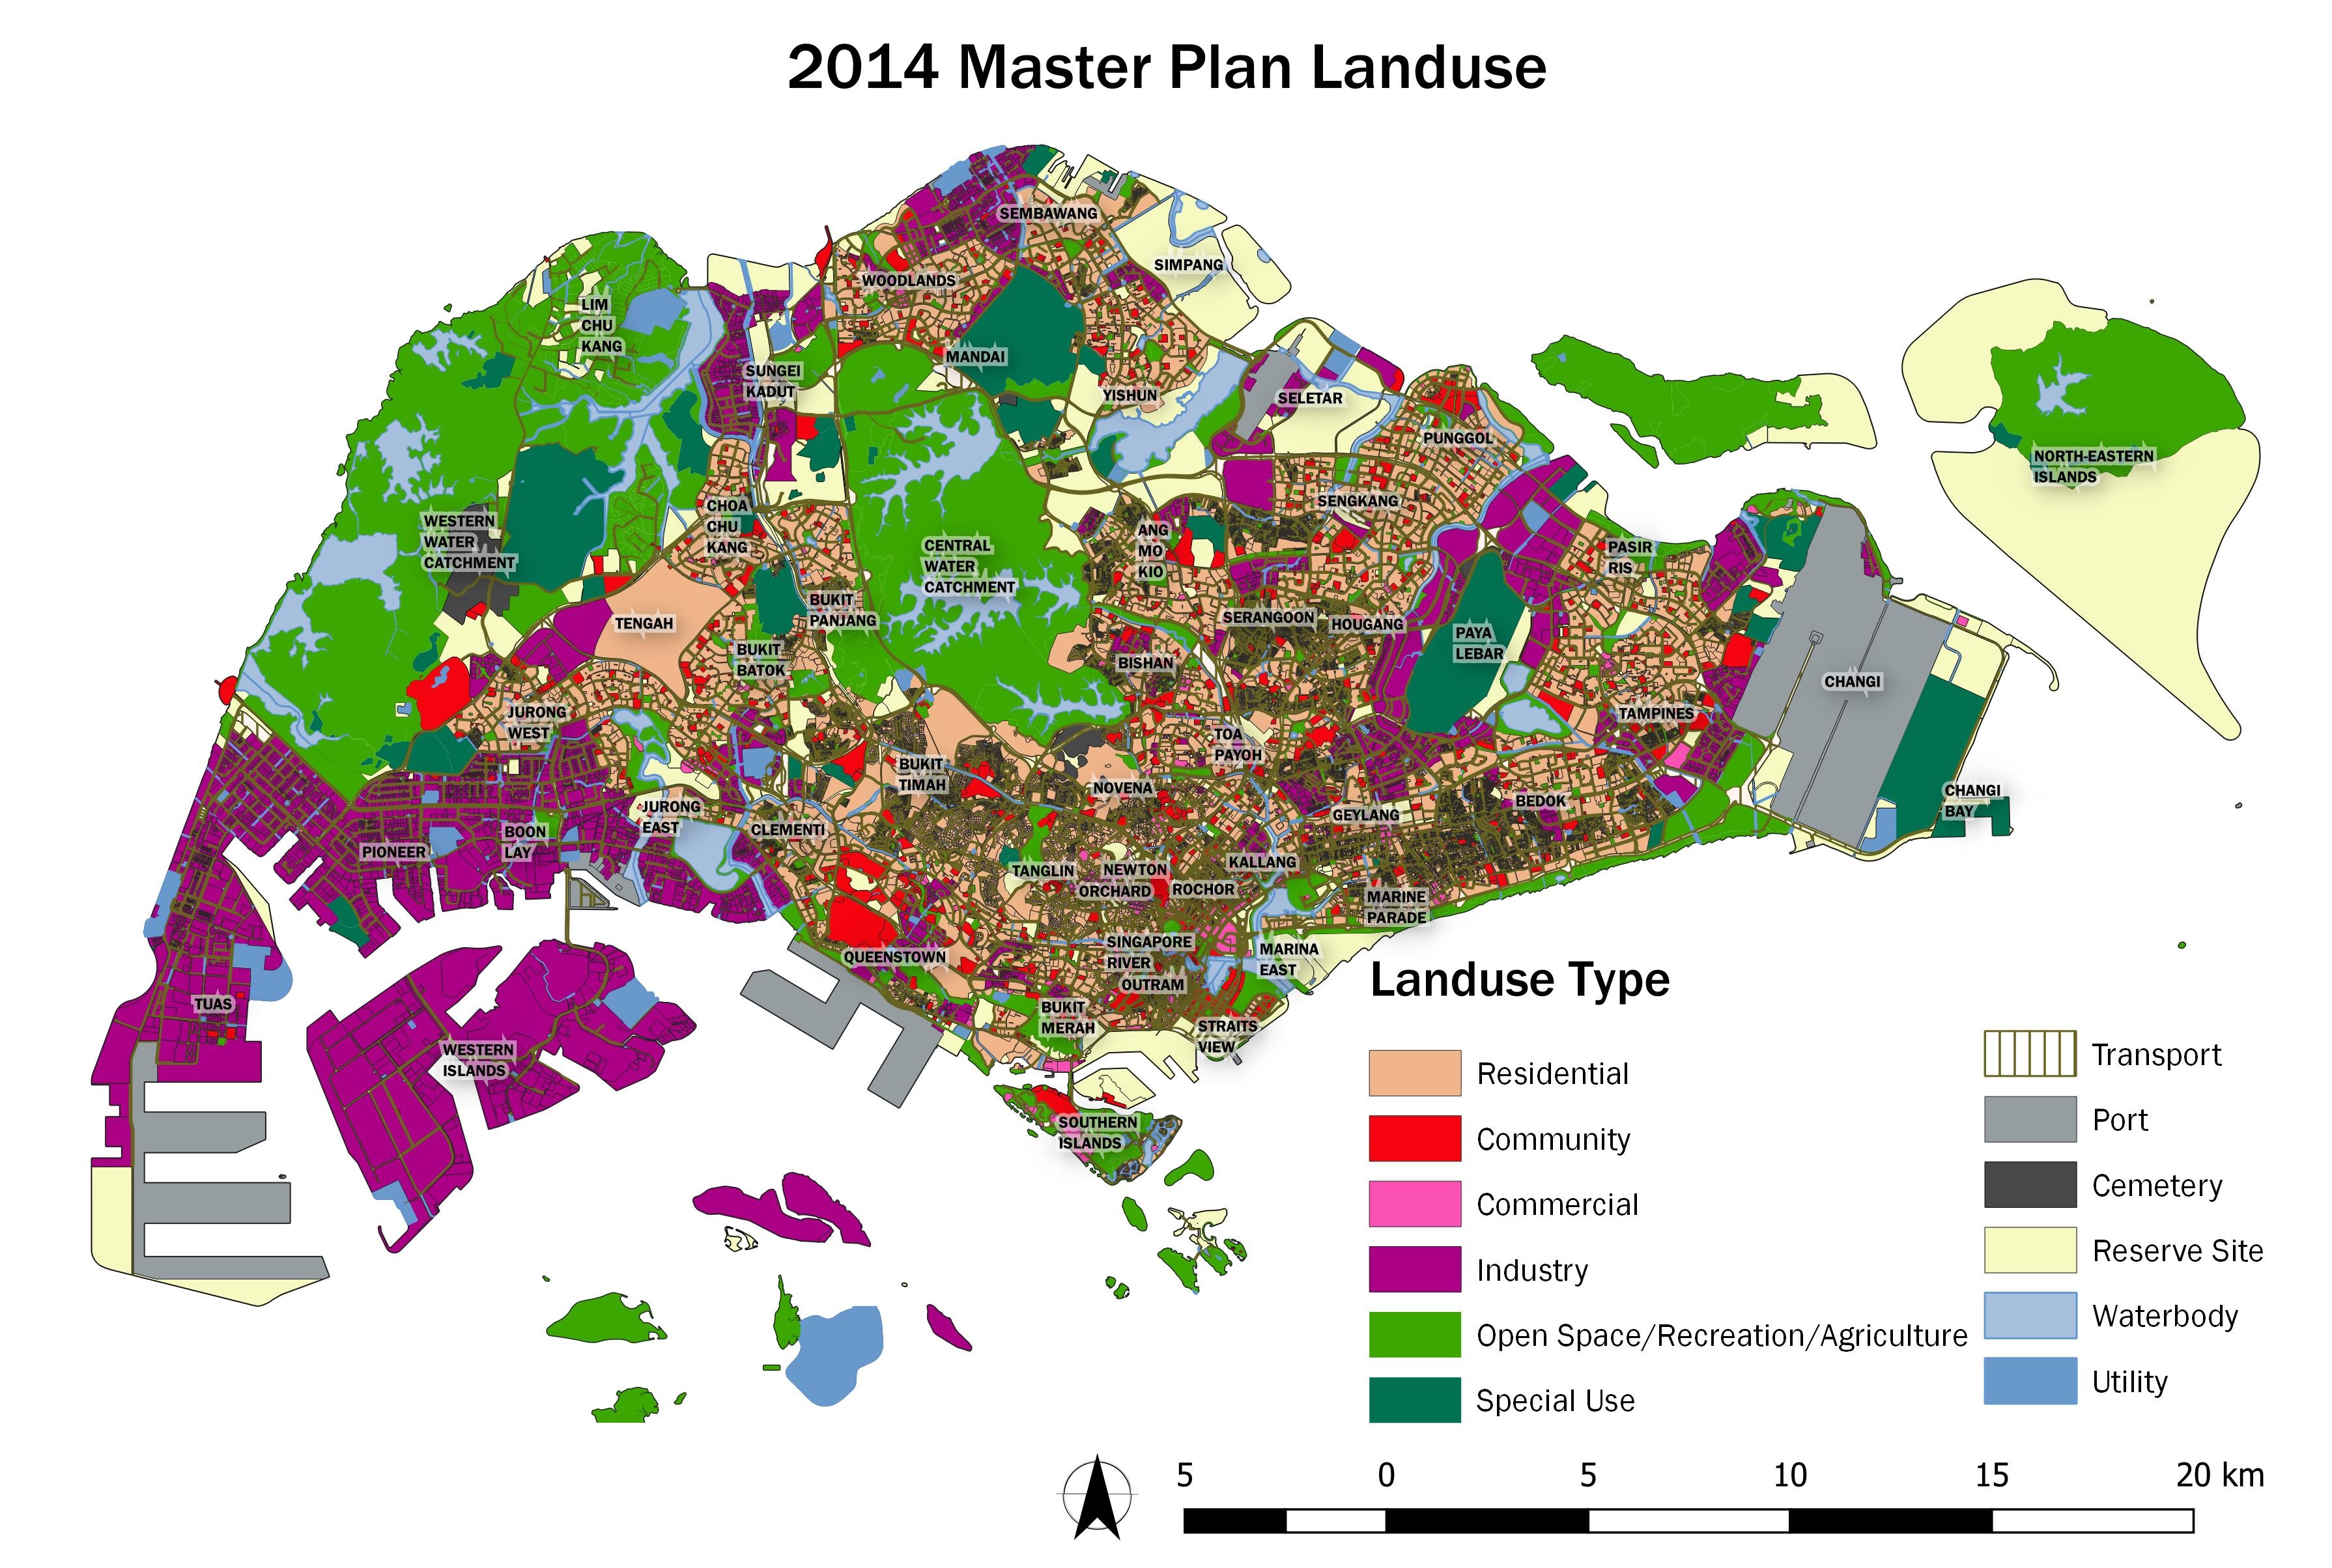
| 15:44, 15 September 2019 | Land use.jpg (file) |  |
1.63 MB | Baihe.soh.2018 | 2 | |
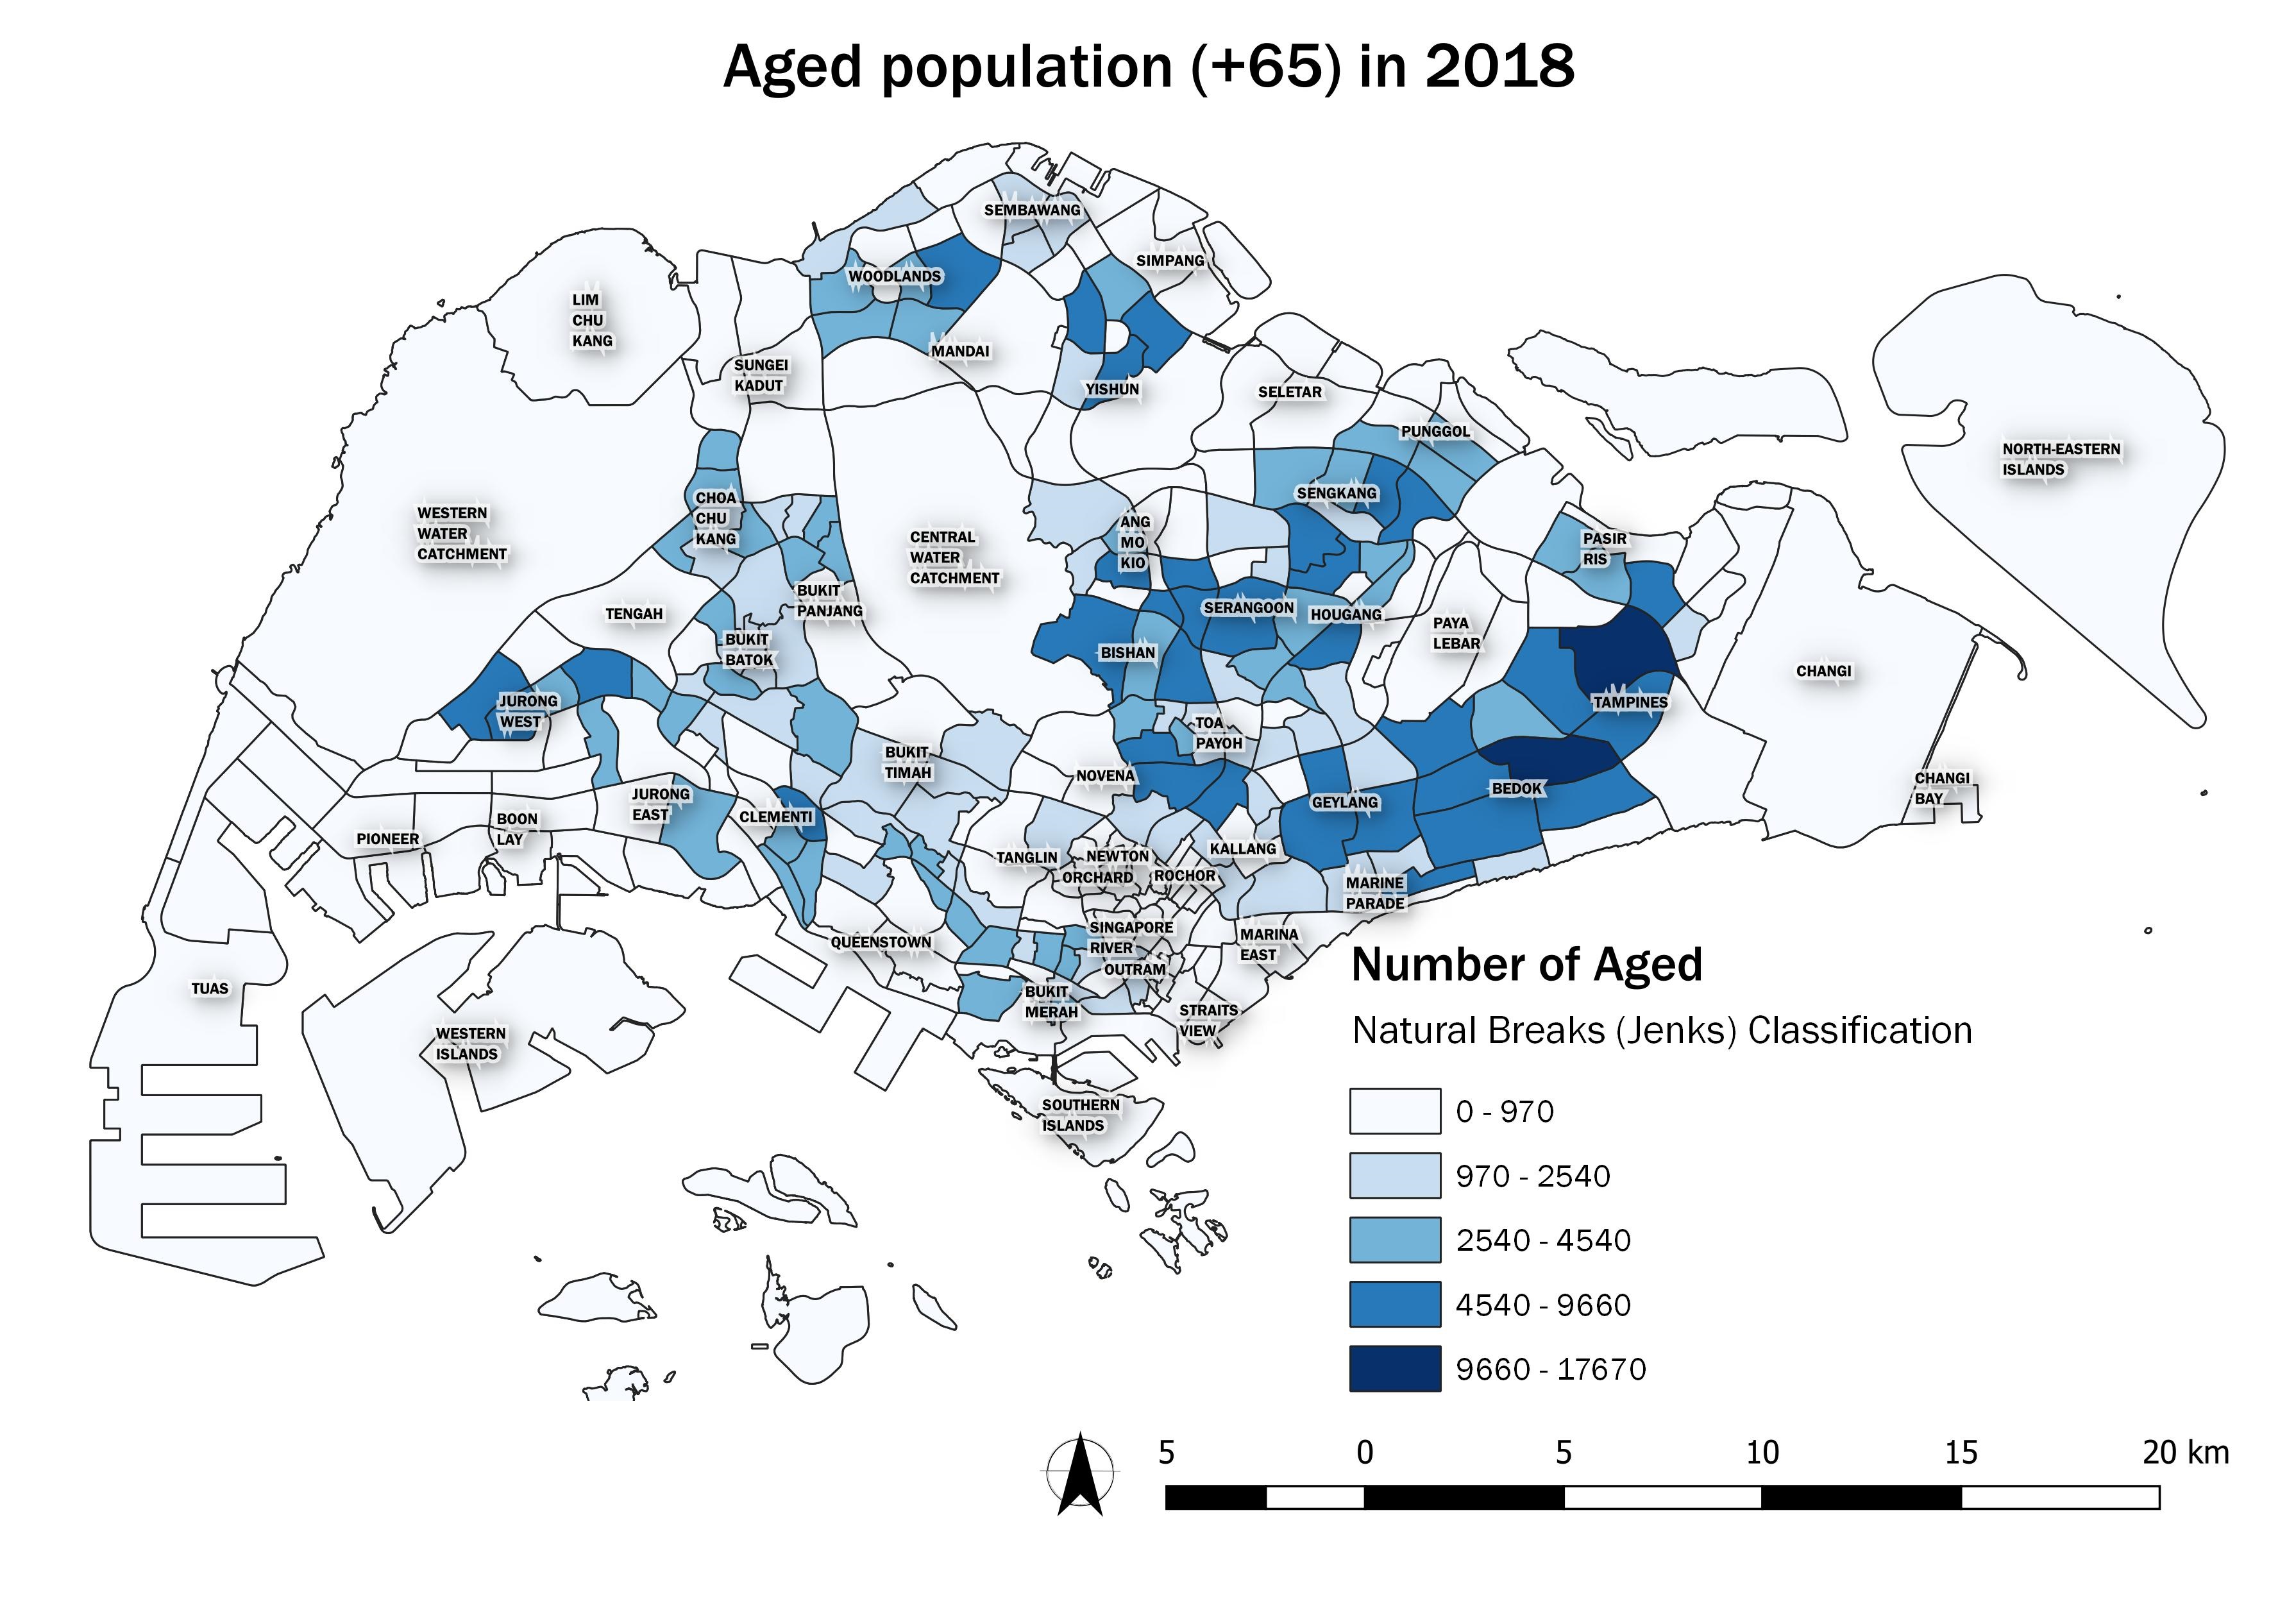
| 15:45, 15 September 2019 | Aged65 2018 confirmed.jpg (file) |  |
531 KB | Genice.goh.2018 | 1 | |
| 15:47, 15 September 2019 | P2a-2010.jpg (file) |  |
1.01 MB | Baihe.soh.2018 | 2 | |
| 15:47, 15 September 2019 | P2a-2018.jpg (file) |  |
1,015 KB | Baihe.soh.2018 | 2 | |
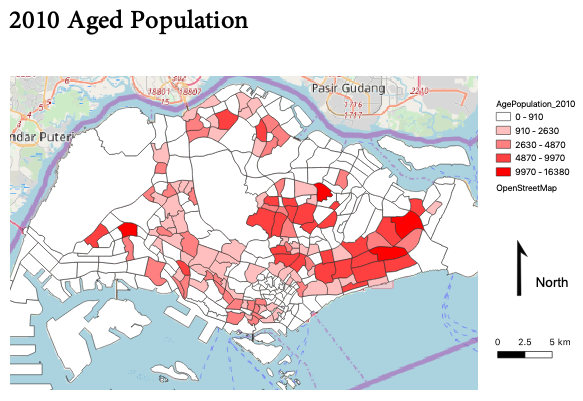
| 15:48, 15 September 2019 | 2010 Aged Population .png (file) |  |
787 KB | Melanie.tan.2018 | 1 | |
| 15:50, 15 September 2019 | P2b-2010.jpg (file) |  |
1.04 MB | Baihe.soh.2018 | 2 | |
| 15:51, 15 September 2019 | P2b-2018.jpg (file) |  |
1.01 MB | Baihe.soh.2018 | 2 | |
| 15:51, 15 September 2019 | LandUse.png (file) |  |
1.84 MB | Seanjin.lee.2018 | updated colours and spelling errors | 2 |
| 15:51, 15 September 2019 | P2c.jpg (file) |  |
1.06 MB | Baihe.soh.2018 | 2 | |
| 15:51, 15 September 2019 | ProportionAged65 2010 confirmed.jpg (file) |  |
527 KB | Genice.goh.2018 | 1 | |
| 15:53, 15 September 2019 | Distributionofsch.jpg (file) |  |
887 KB | Andrea.yiap.2018 | 1 | |
| 15:54, 15 September 2019 | ProportionAged65 2018 confirmed.jpg (file) |  |
531 KB | Genice.goh.2018 | 1 | |
| 15:55, 15 September 2019 | Aged Population in 2010 .png (file) |  |
177 KB | Jttan.2018 | 1 | |
| 15:57, 15 September 2019 | Aged Population in 2018 Christine.png (file) |  |
184 KB | Jttan.2018 | 1 | |
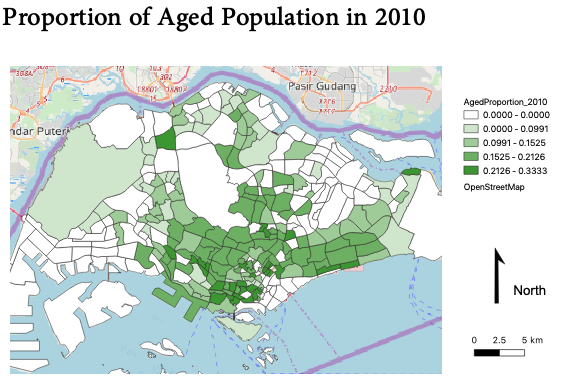
| 15:58, 15 September 2019 | 2010pro christine .png (file) |  |
175 KB | Jttan.2018 | 1 | |
| 15:58, 15 September 2019 | Aged population 2010.png (file) |  |
131 KB | Yu.zang.2016 | 1 | |
| 15:59, 15 September 2019 | 2018pro Christine.png (file) |  |
182 KB | Jttan.2018 | 1 | |
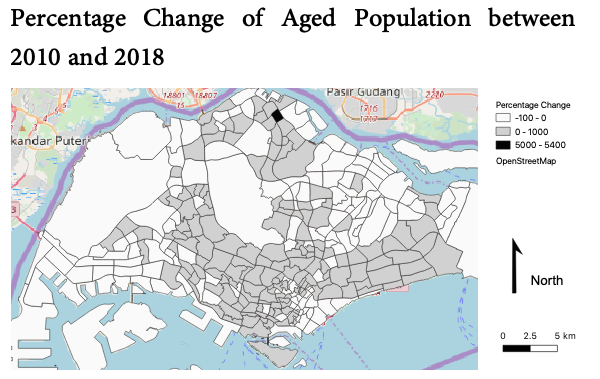
| 16:00, 15 September 2019 | Percent Christine.png (file) |  |
164 KB | Jttan.2018 | 1 | |
| 16:02, 15 September 2019 | PercentageChange confirmed.jpg (file) |  |
575 KB | Genice.goh.2018 | 1 | |
| 16:07, 15 September 2019 | 2010AgeGenderMap.png (file) |  |
1,015 KB | Lhkhong.2018 | 1 | |
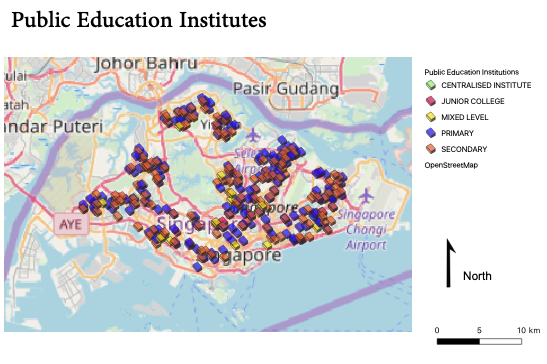
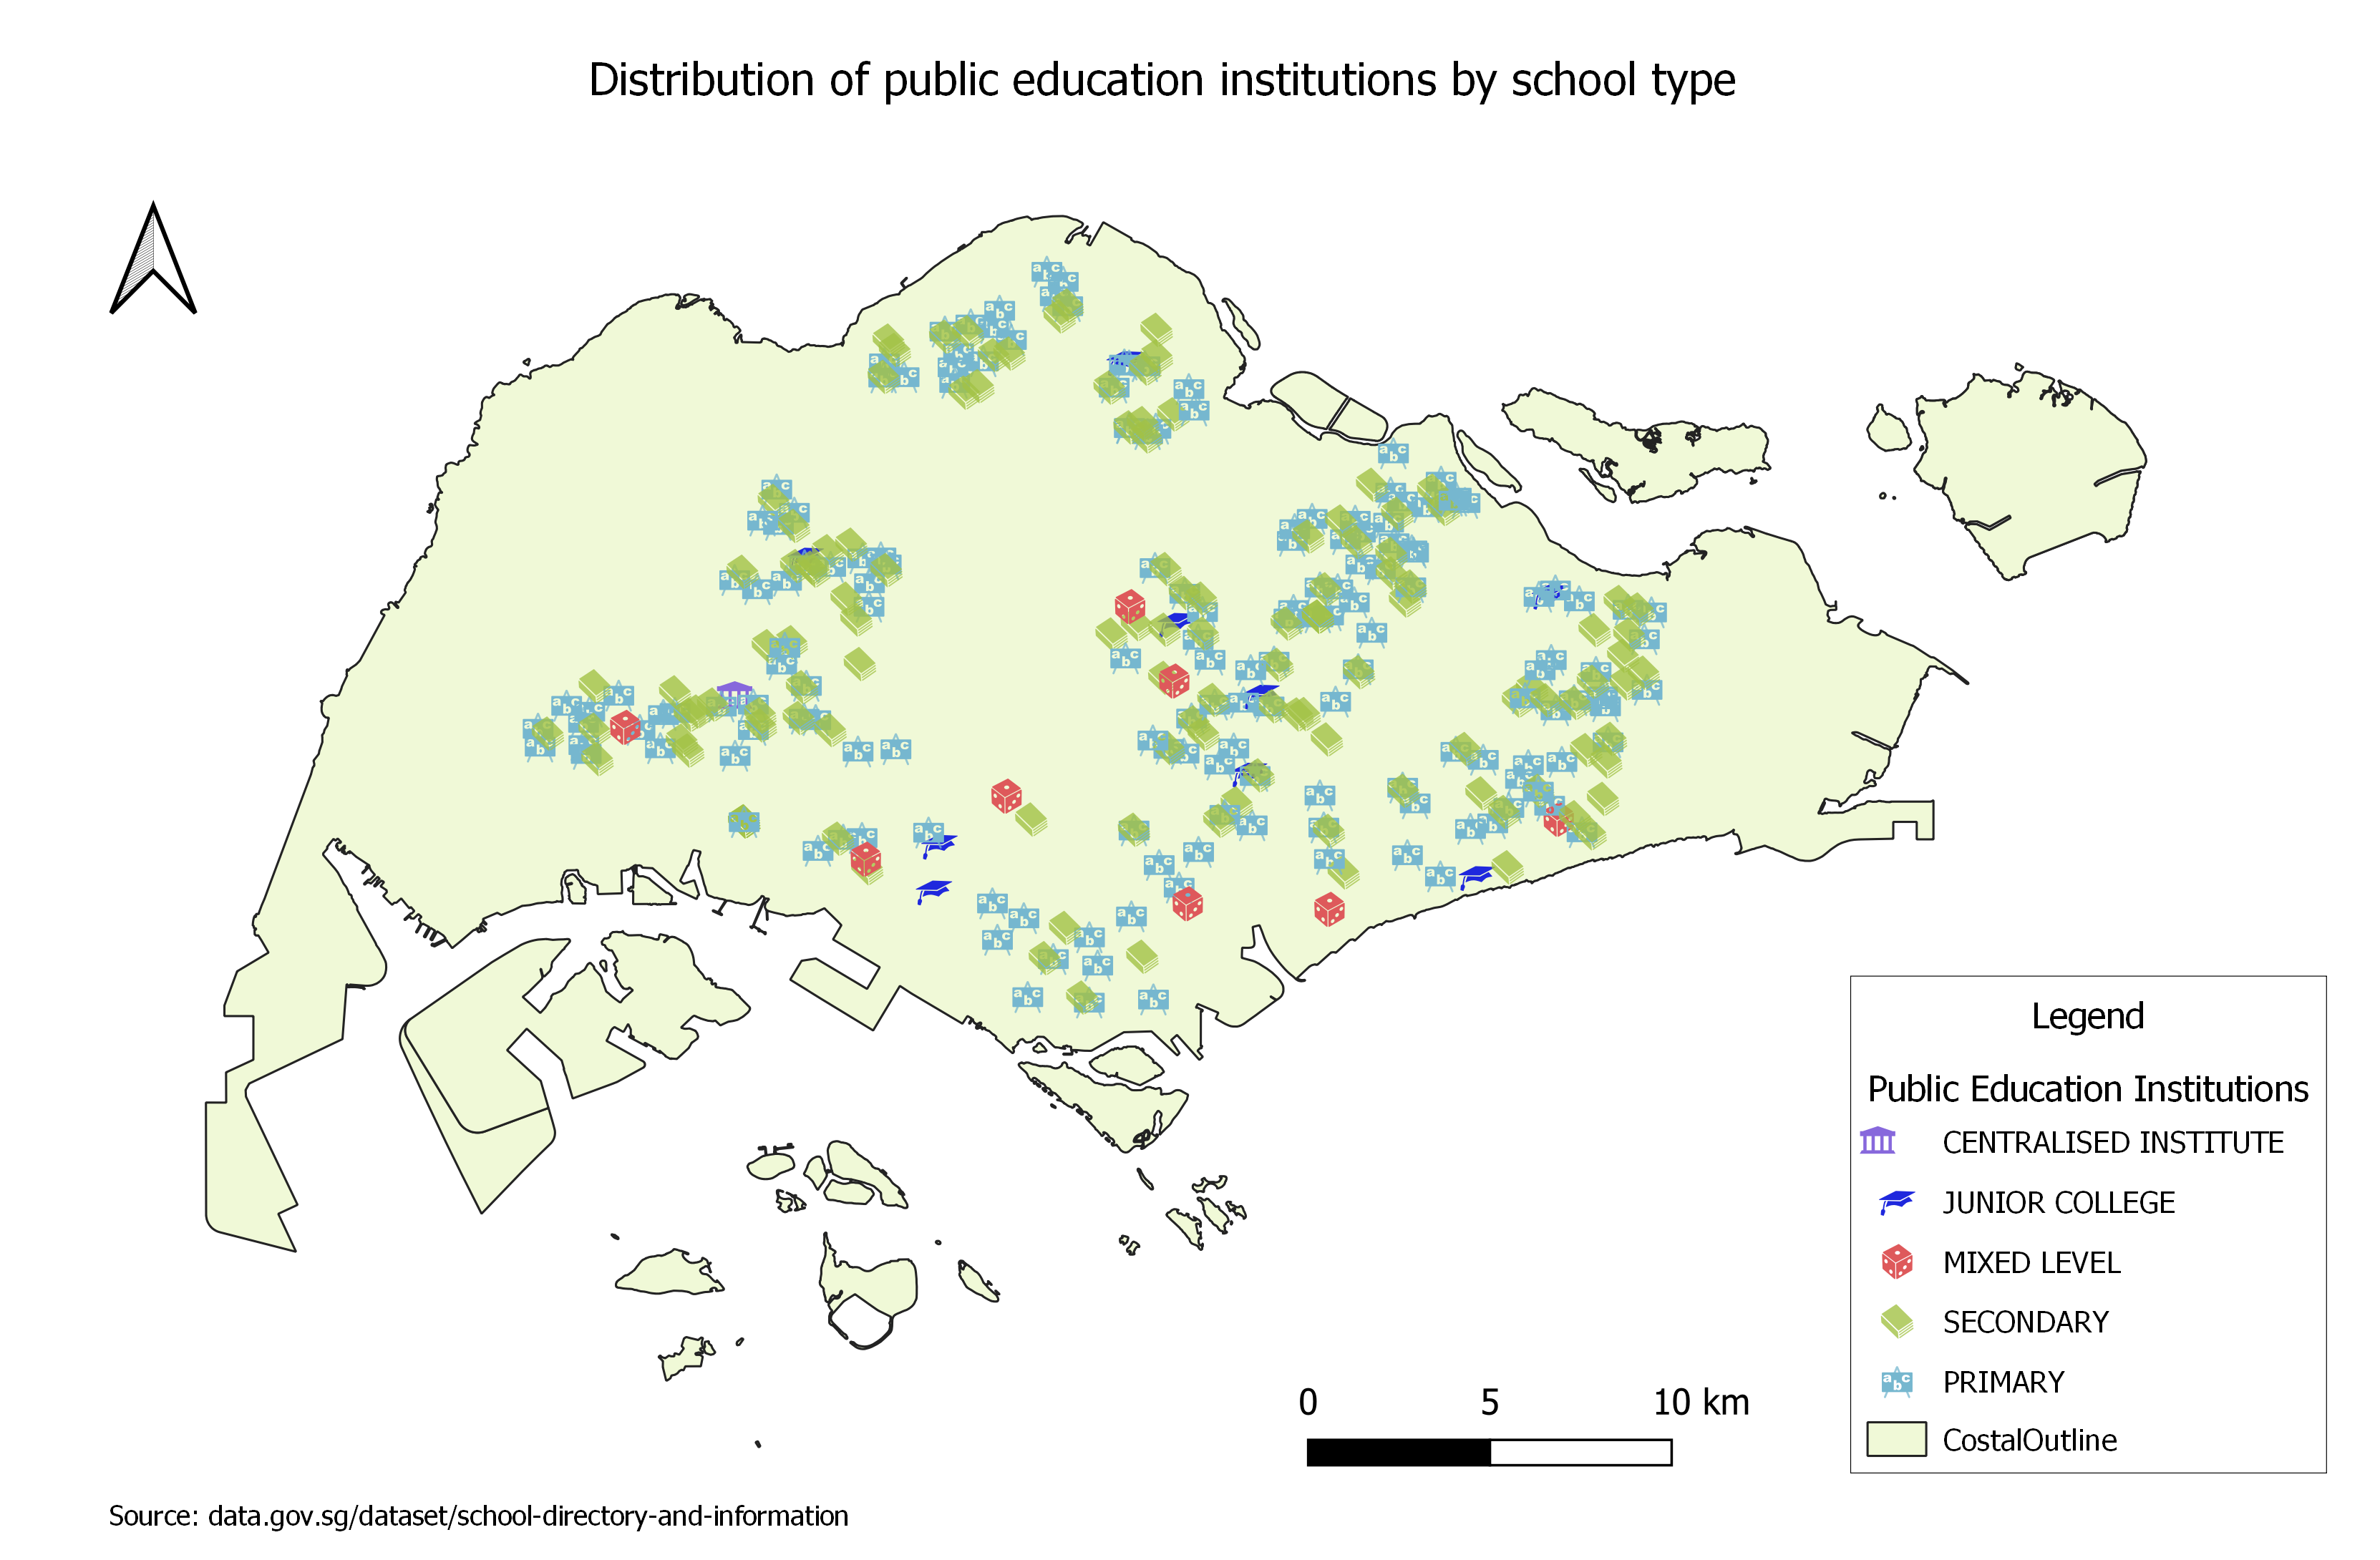
| 16:07, 15 September 2019 | Education.jpg (file) |  |
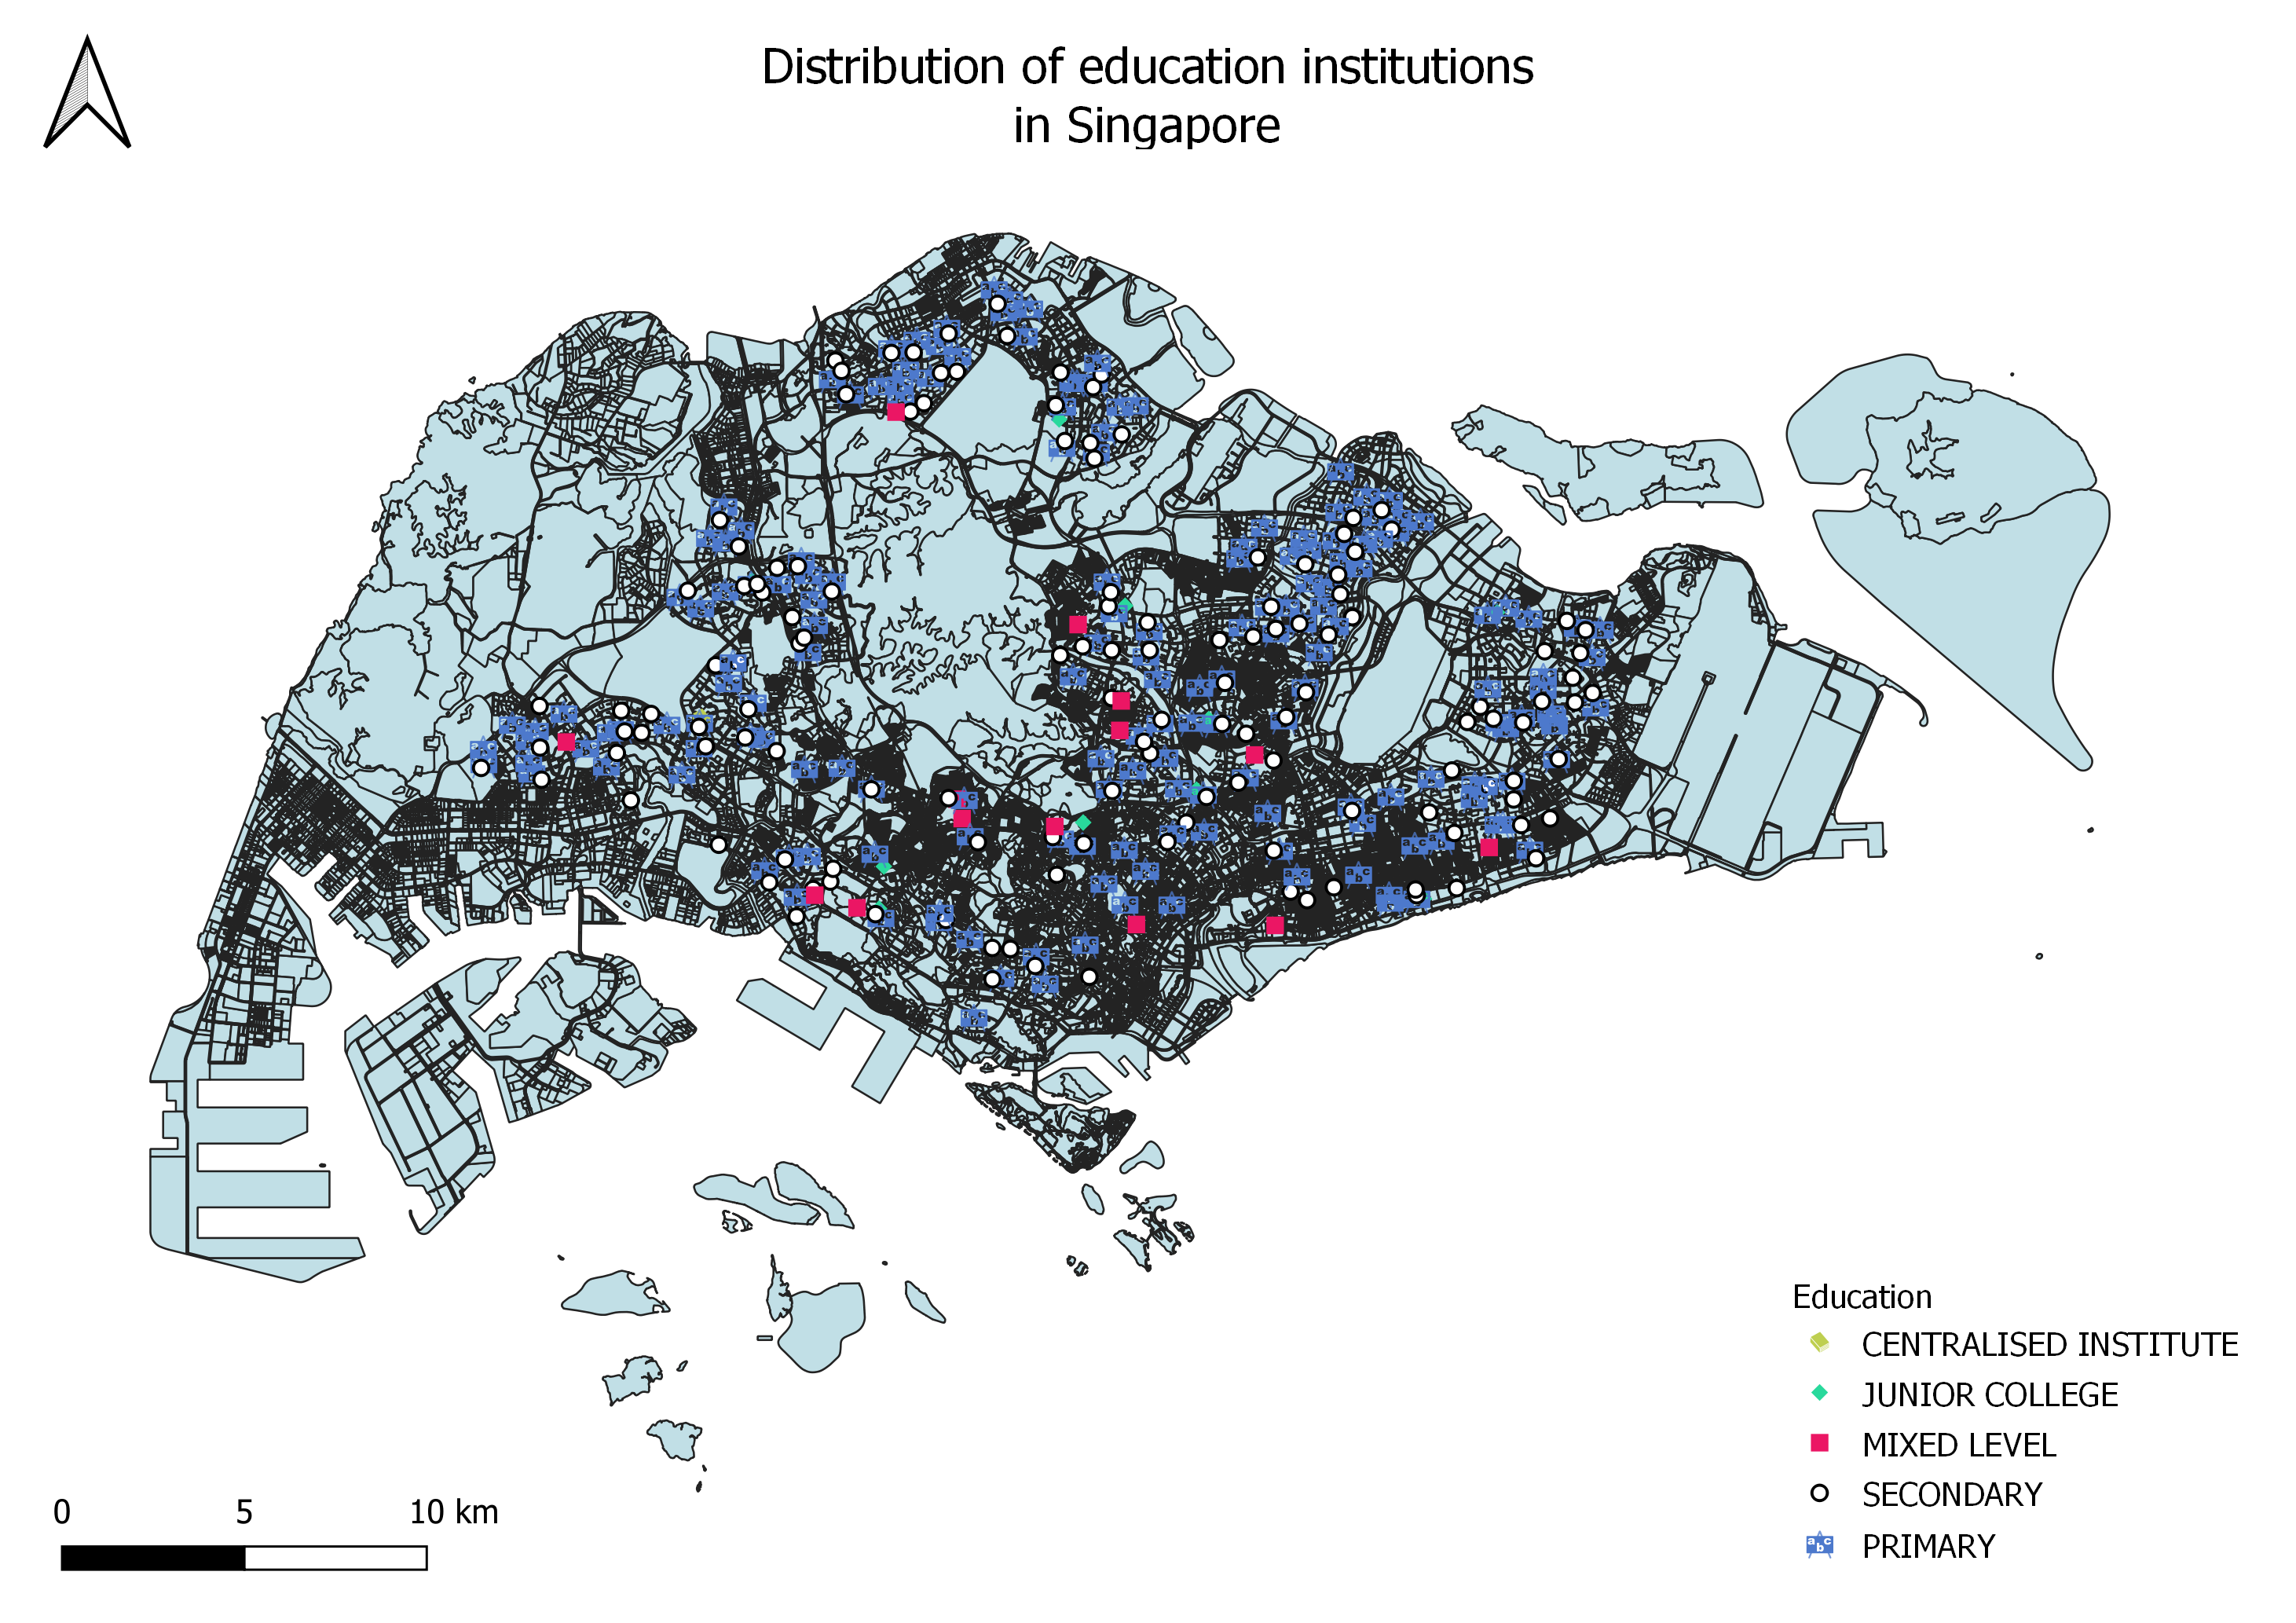
1.73 MB | Vanessa.au.2018 | The Education layer and the MP14 Landuse layer can be seen in this image. The different SVG markers represent the different types of educational institutes in Singapore. | 1 |
| 16:08, 15 September 2019 | Singapore 2014 Master Plan Landuse.png (file) |  |
952 KB | Jerome.quah.2018 | 1 | |
| 16:10, 15 September 2019 | 2010 Proportion of Aged Population in Singapore.png (file) |  |
1.13 MB | Bcheng.2018 | 1 | |
| 16:12, 15 September 2019 | 2018 Proportion of Aged Population in Singapore.png (file) |  |
1.47 MB | Bcheng.2018 | 1 | |
| 16:12, 15 September 2019 | 2018AgeGenderMap.png (file) |  |
1.03 MB | Lhkhong.2018 | 1 | |
| 16:14, 15 September 2019 | Percentage Change in Aged Population between 2010 and 2018.png (file) |  |
1.35 MB | Bcheng.2018 | 1 | |
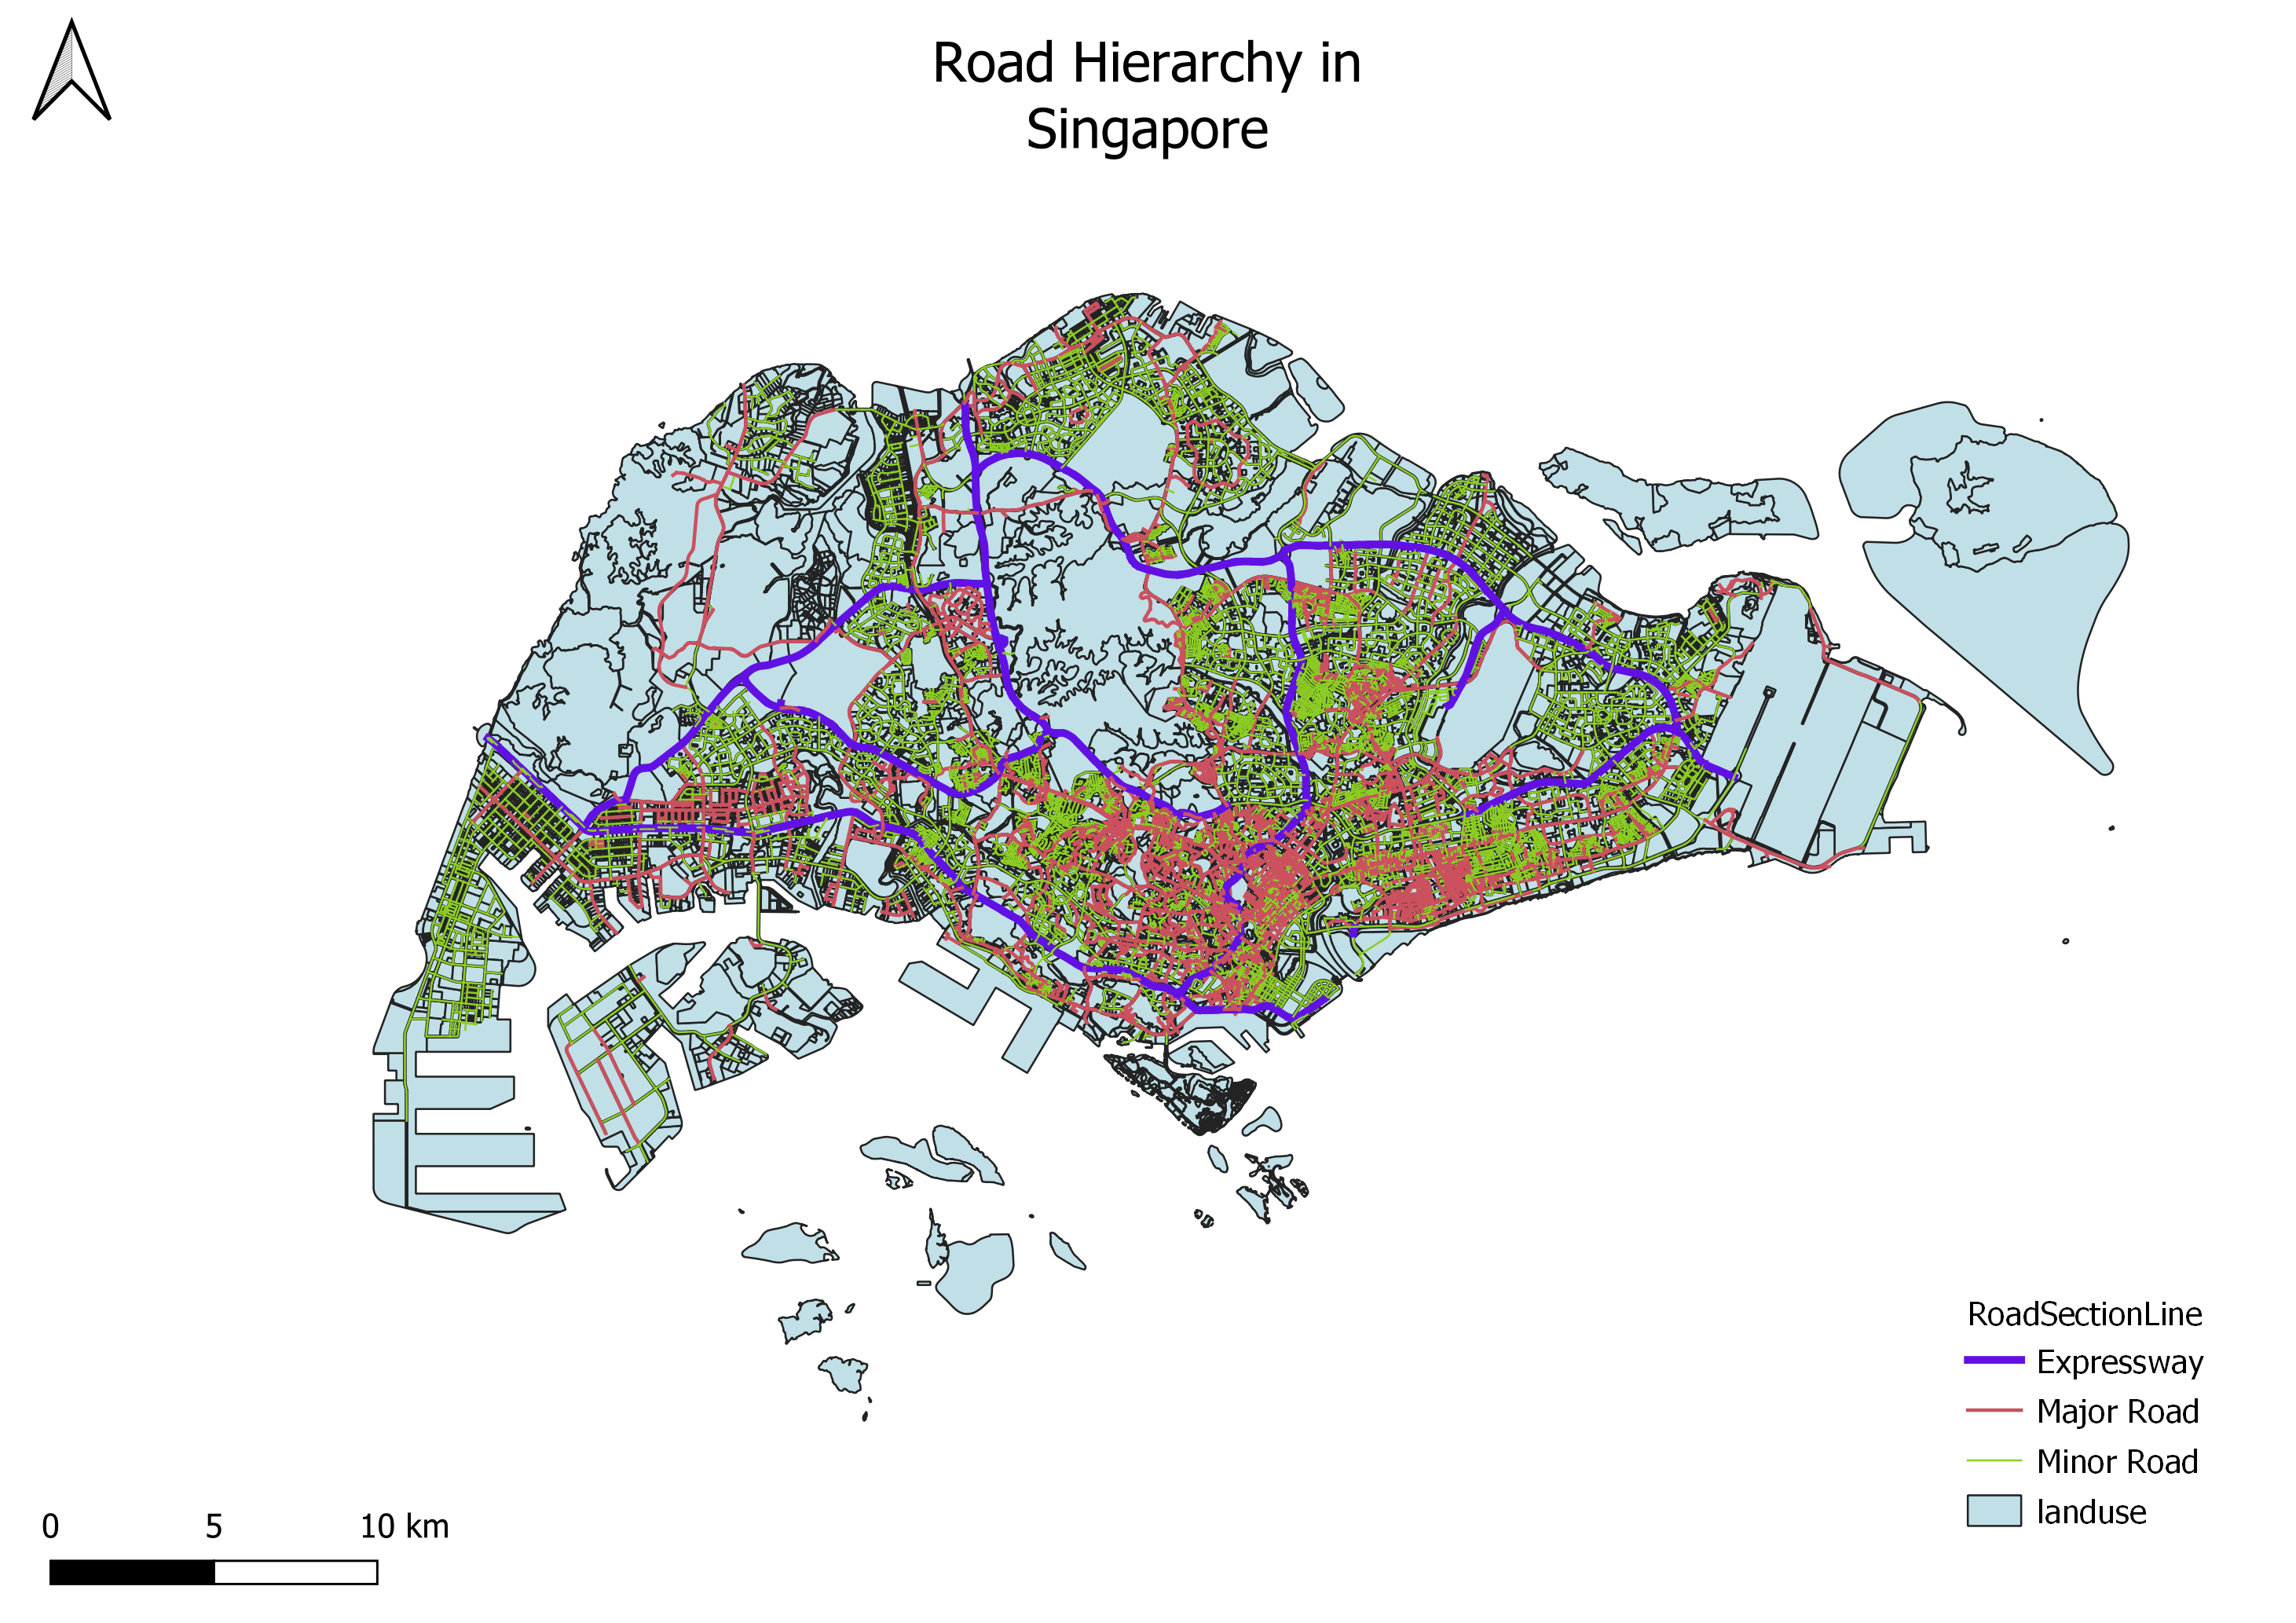
| 16:14, 15 September 2019 | Road hierarchy.png (file) |  |
1.92 MB | Vanessa.au.2018 | The different lines of varying widths and colours represent the different types of roads in Singapore, namely the expressways, major roads and minor roads. | 1 |
| 16:15, 15 September 2019 | Q2 Part 2b(1).png (file) | .png) |
1,014 KB | Jolene.pek.2018 | 1 | |
| 16:18, 15 September 2019 | Leandra school type.png (file) |  |
856 KB | Leandralee.2018 | 2 | |
| 16:22, 15 September 2019 | Public Schools.png (file) |  |
1.12 MB | Huiyun.kang.2016 | Used region base instead of coastal outline | 3 |
| 16:23, 15 September 2019 | Road Network System Kang Hui Yun.png (file) |  |
1.96 MB | Huiyun.kang.2016 | 2 | |
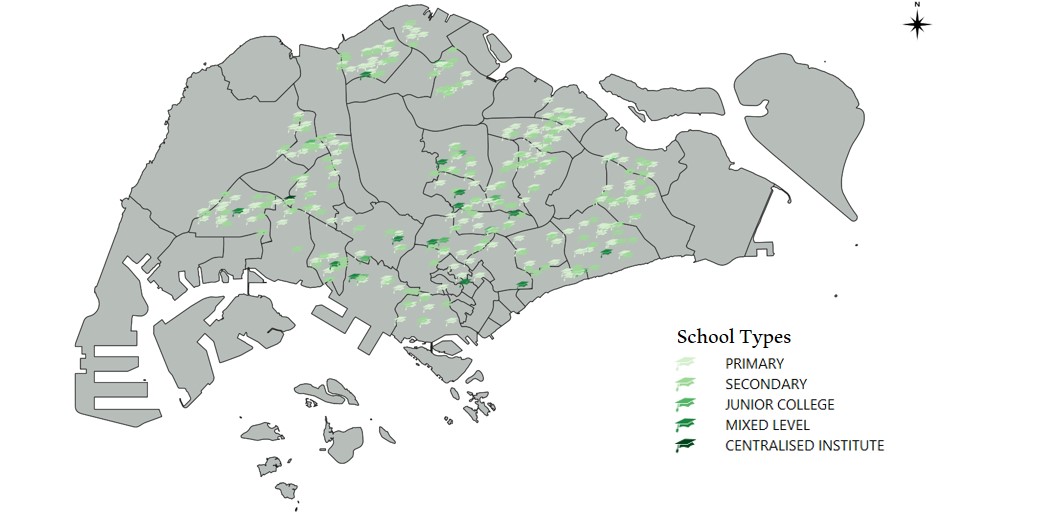
| 16:29, 15 September 2019 | Thematic - SchoolTypes.jpg (file) |  |
78 KB | Eugene.kim.2018 | Thematic Mapping - School Types | 1 |
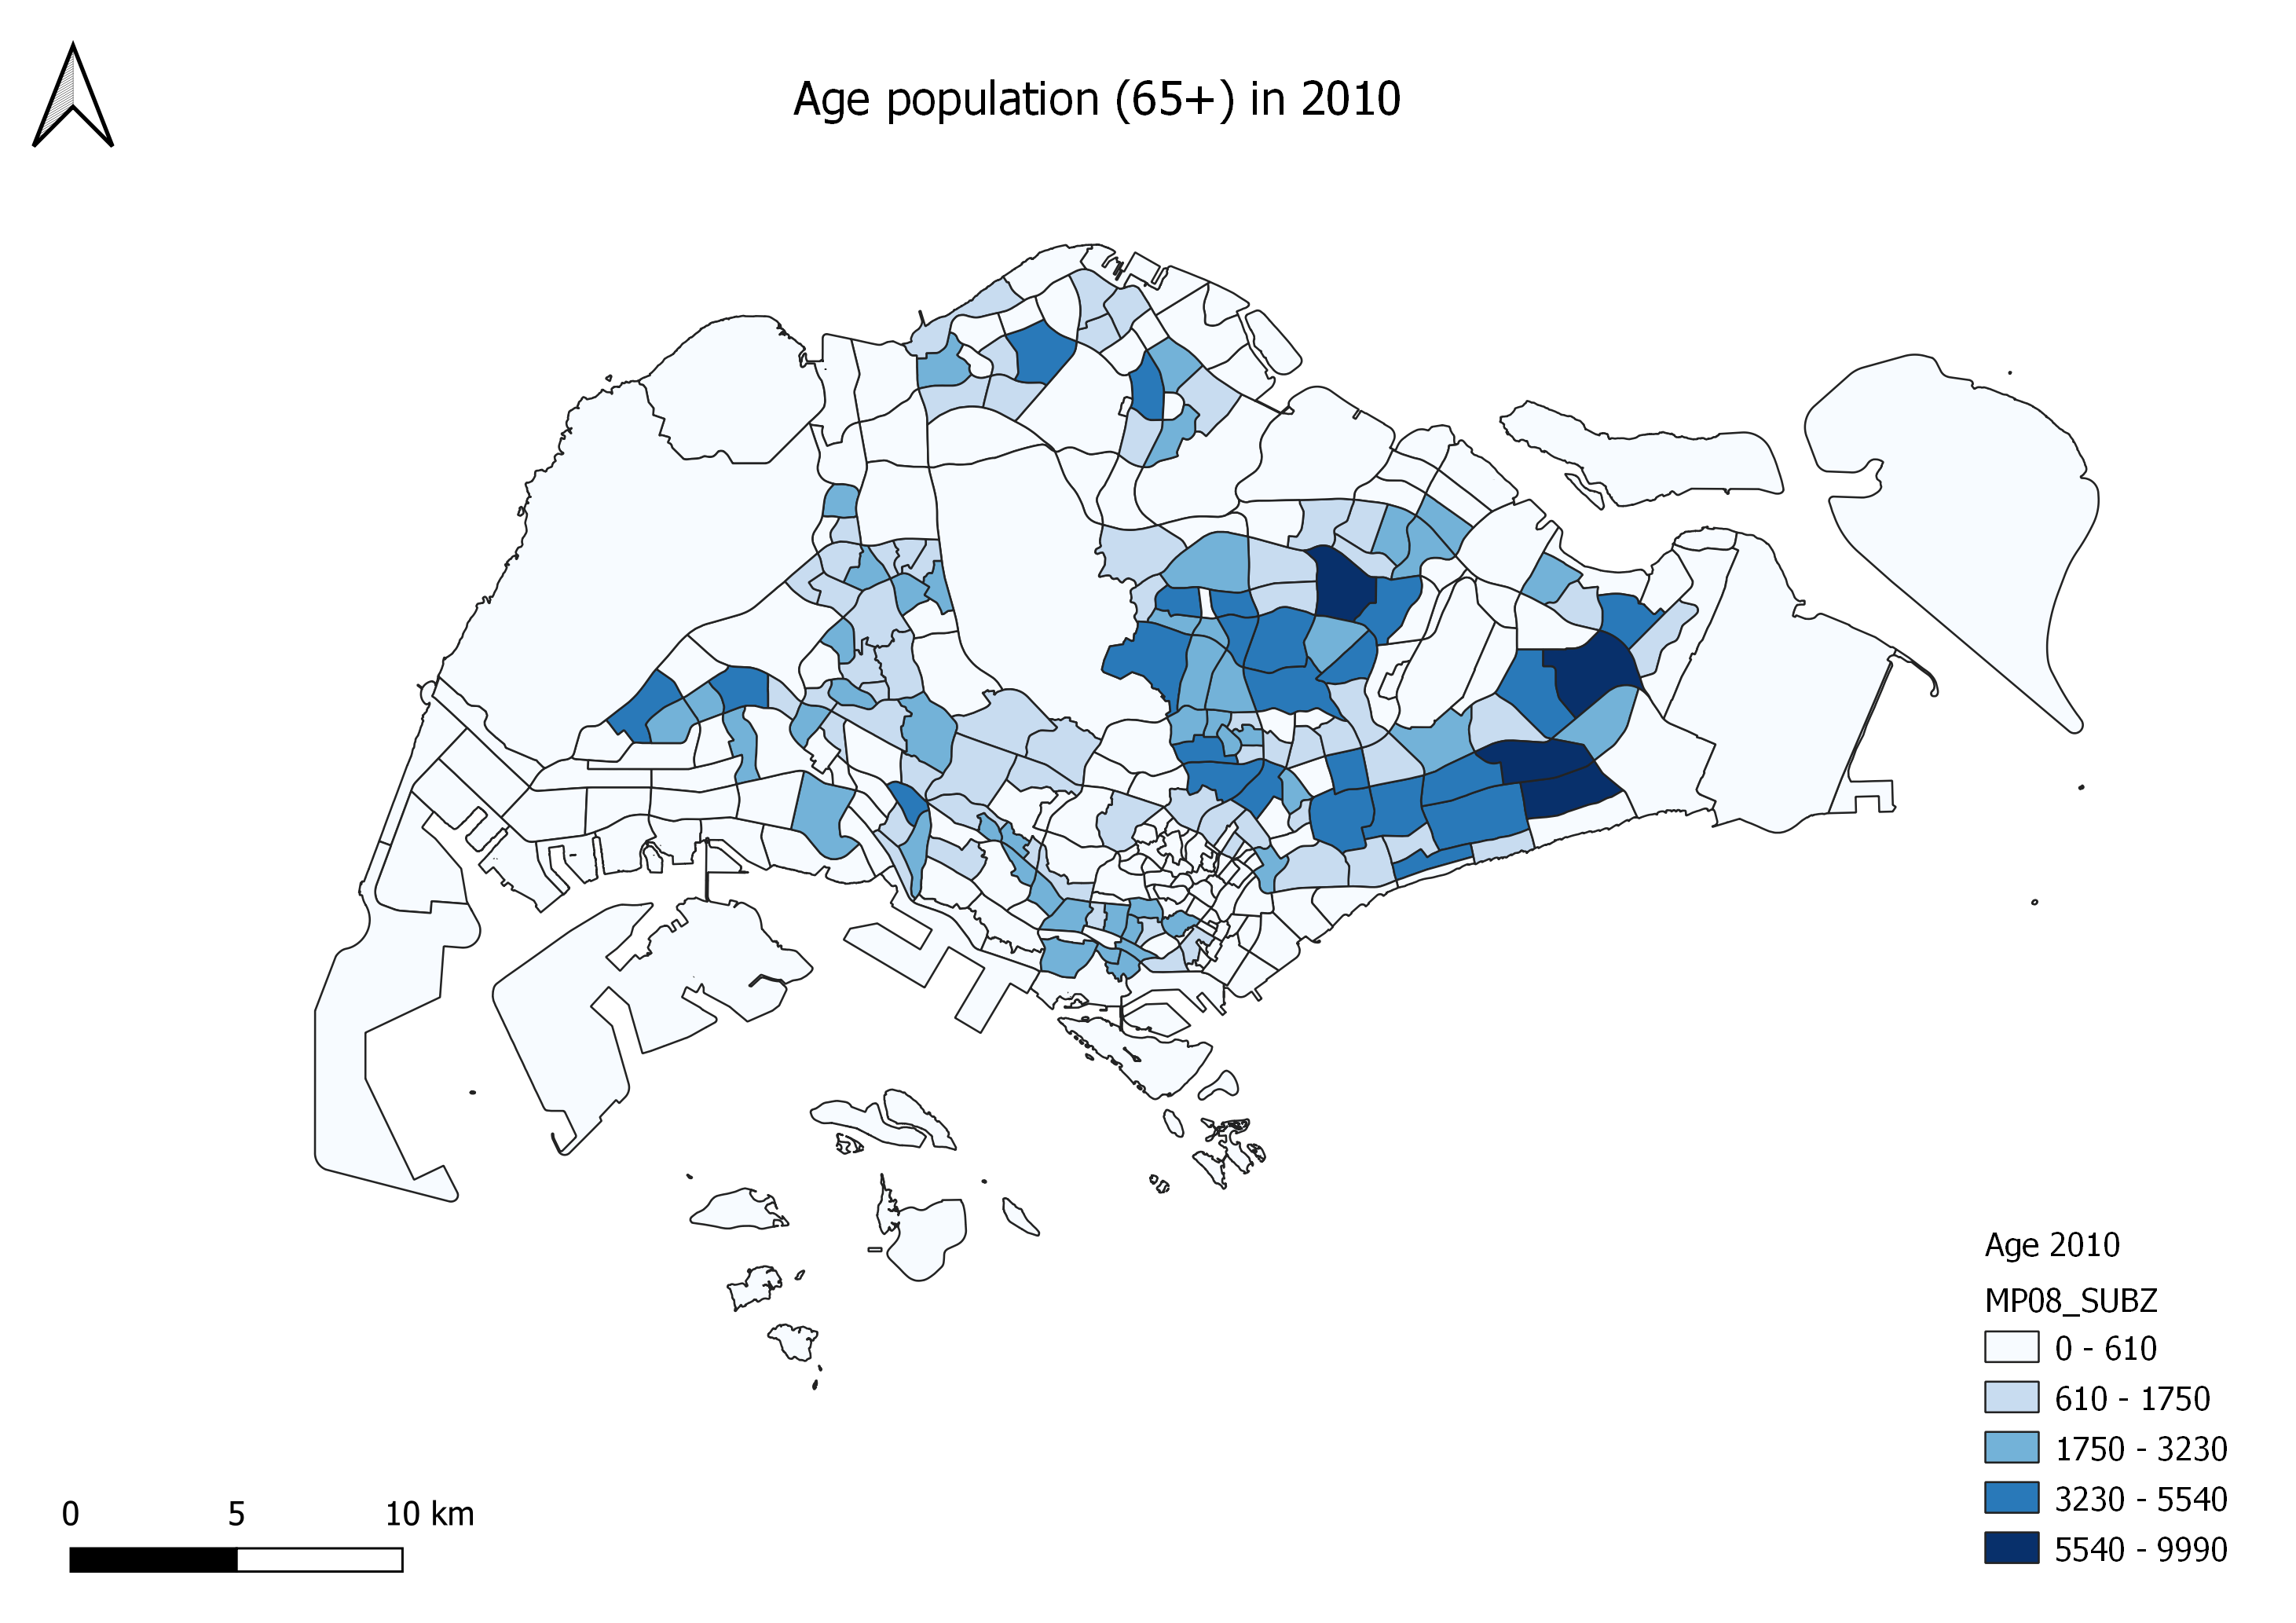
| 16:29, 15 September 2019 | Age 2010.png (file) |  |
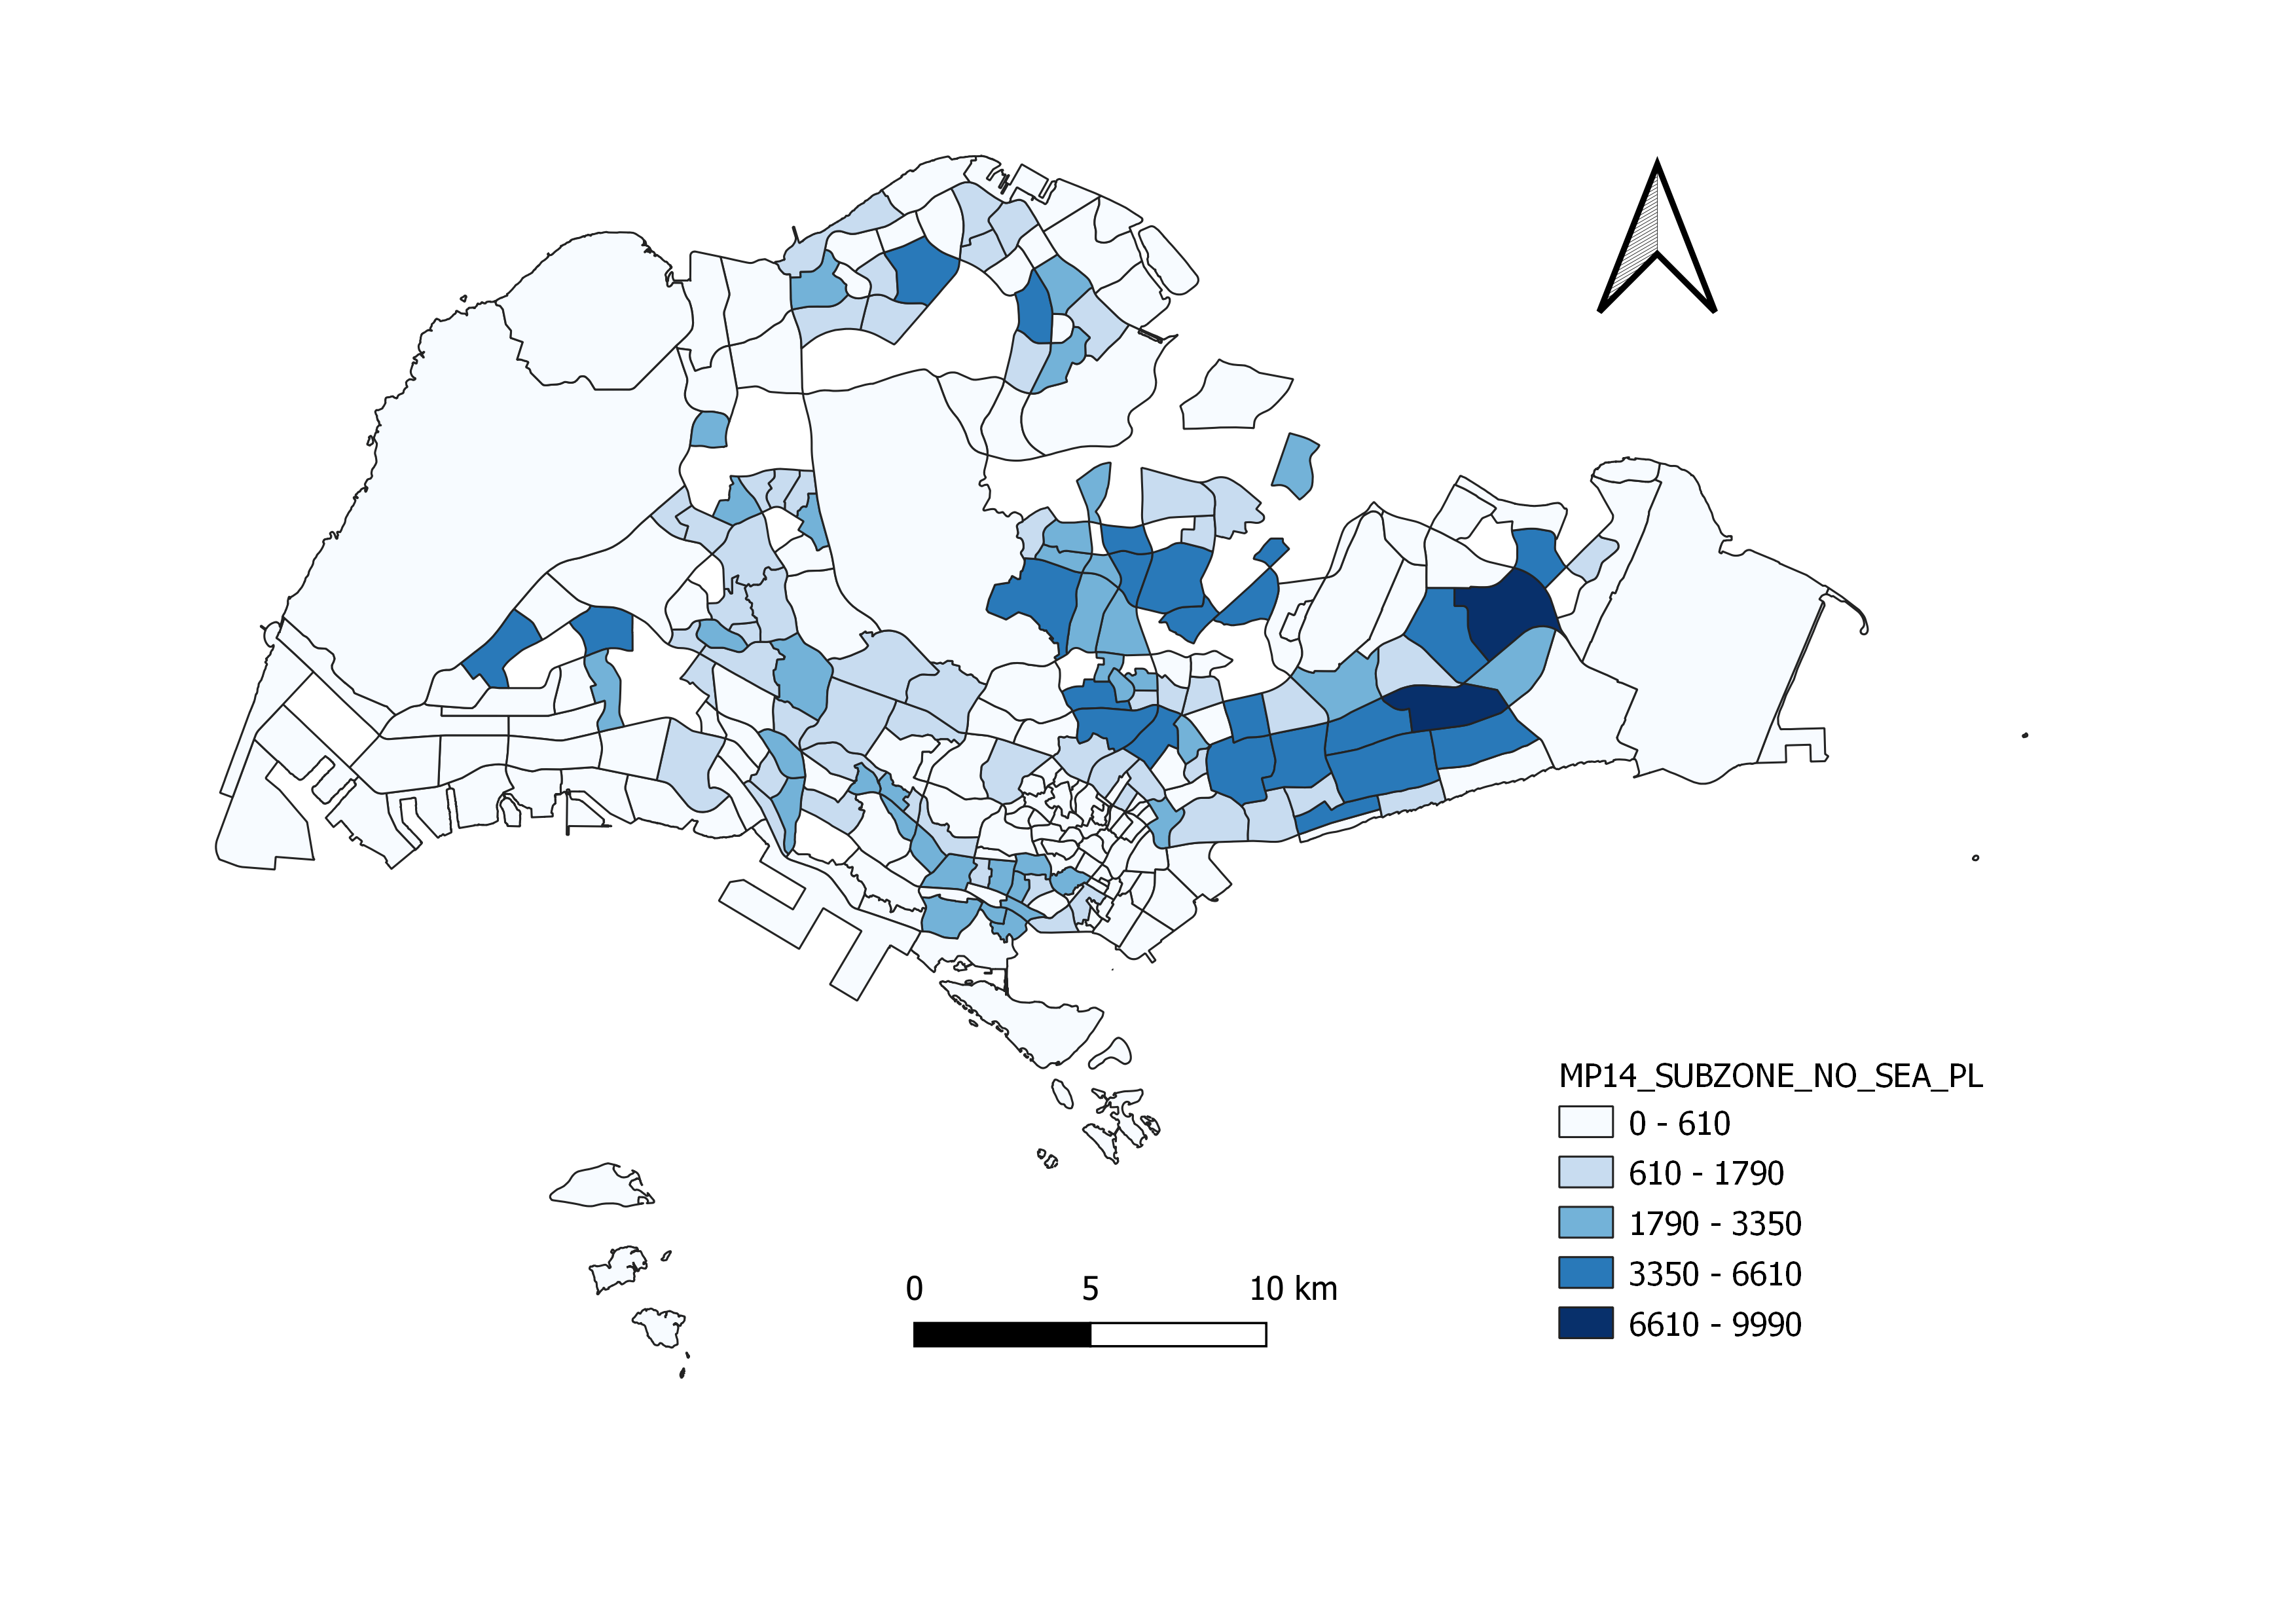
735 KB | Vanessa.au.2018 | This map shows the distribution of the population aged 65 years old and above in 2010. The varying intensity of colours indicate the number of people aged 65+ in each planning subzone. Darker intensity highlights that the planning area has a higher num... | 1 |
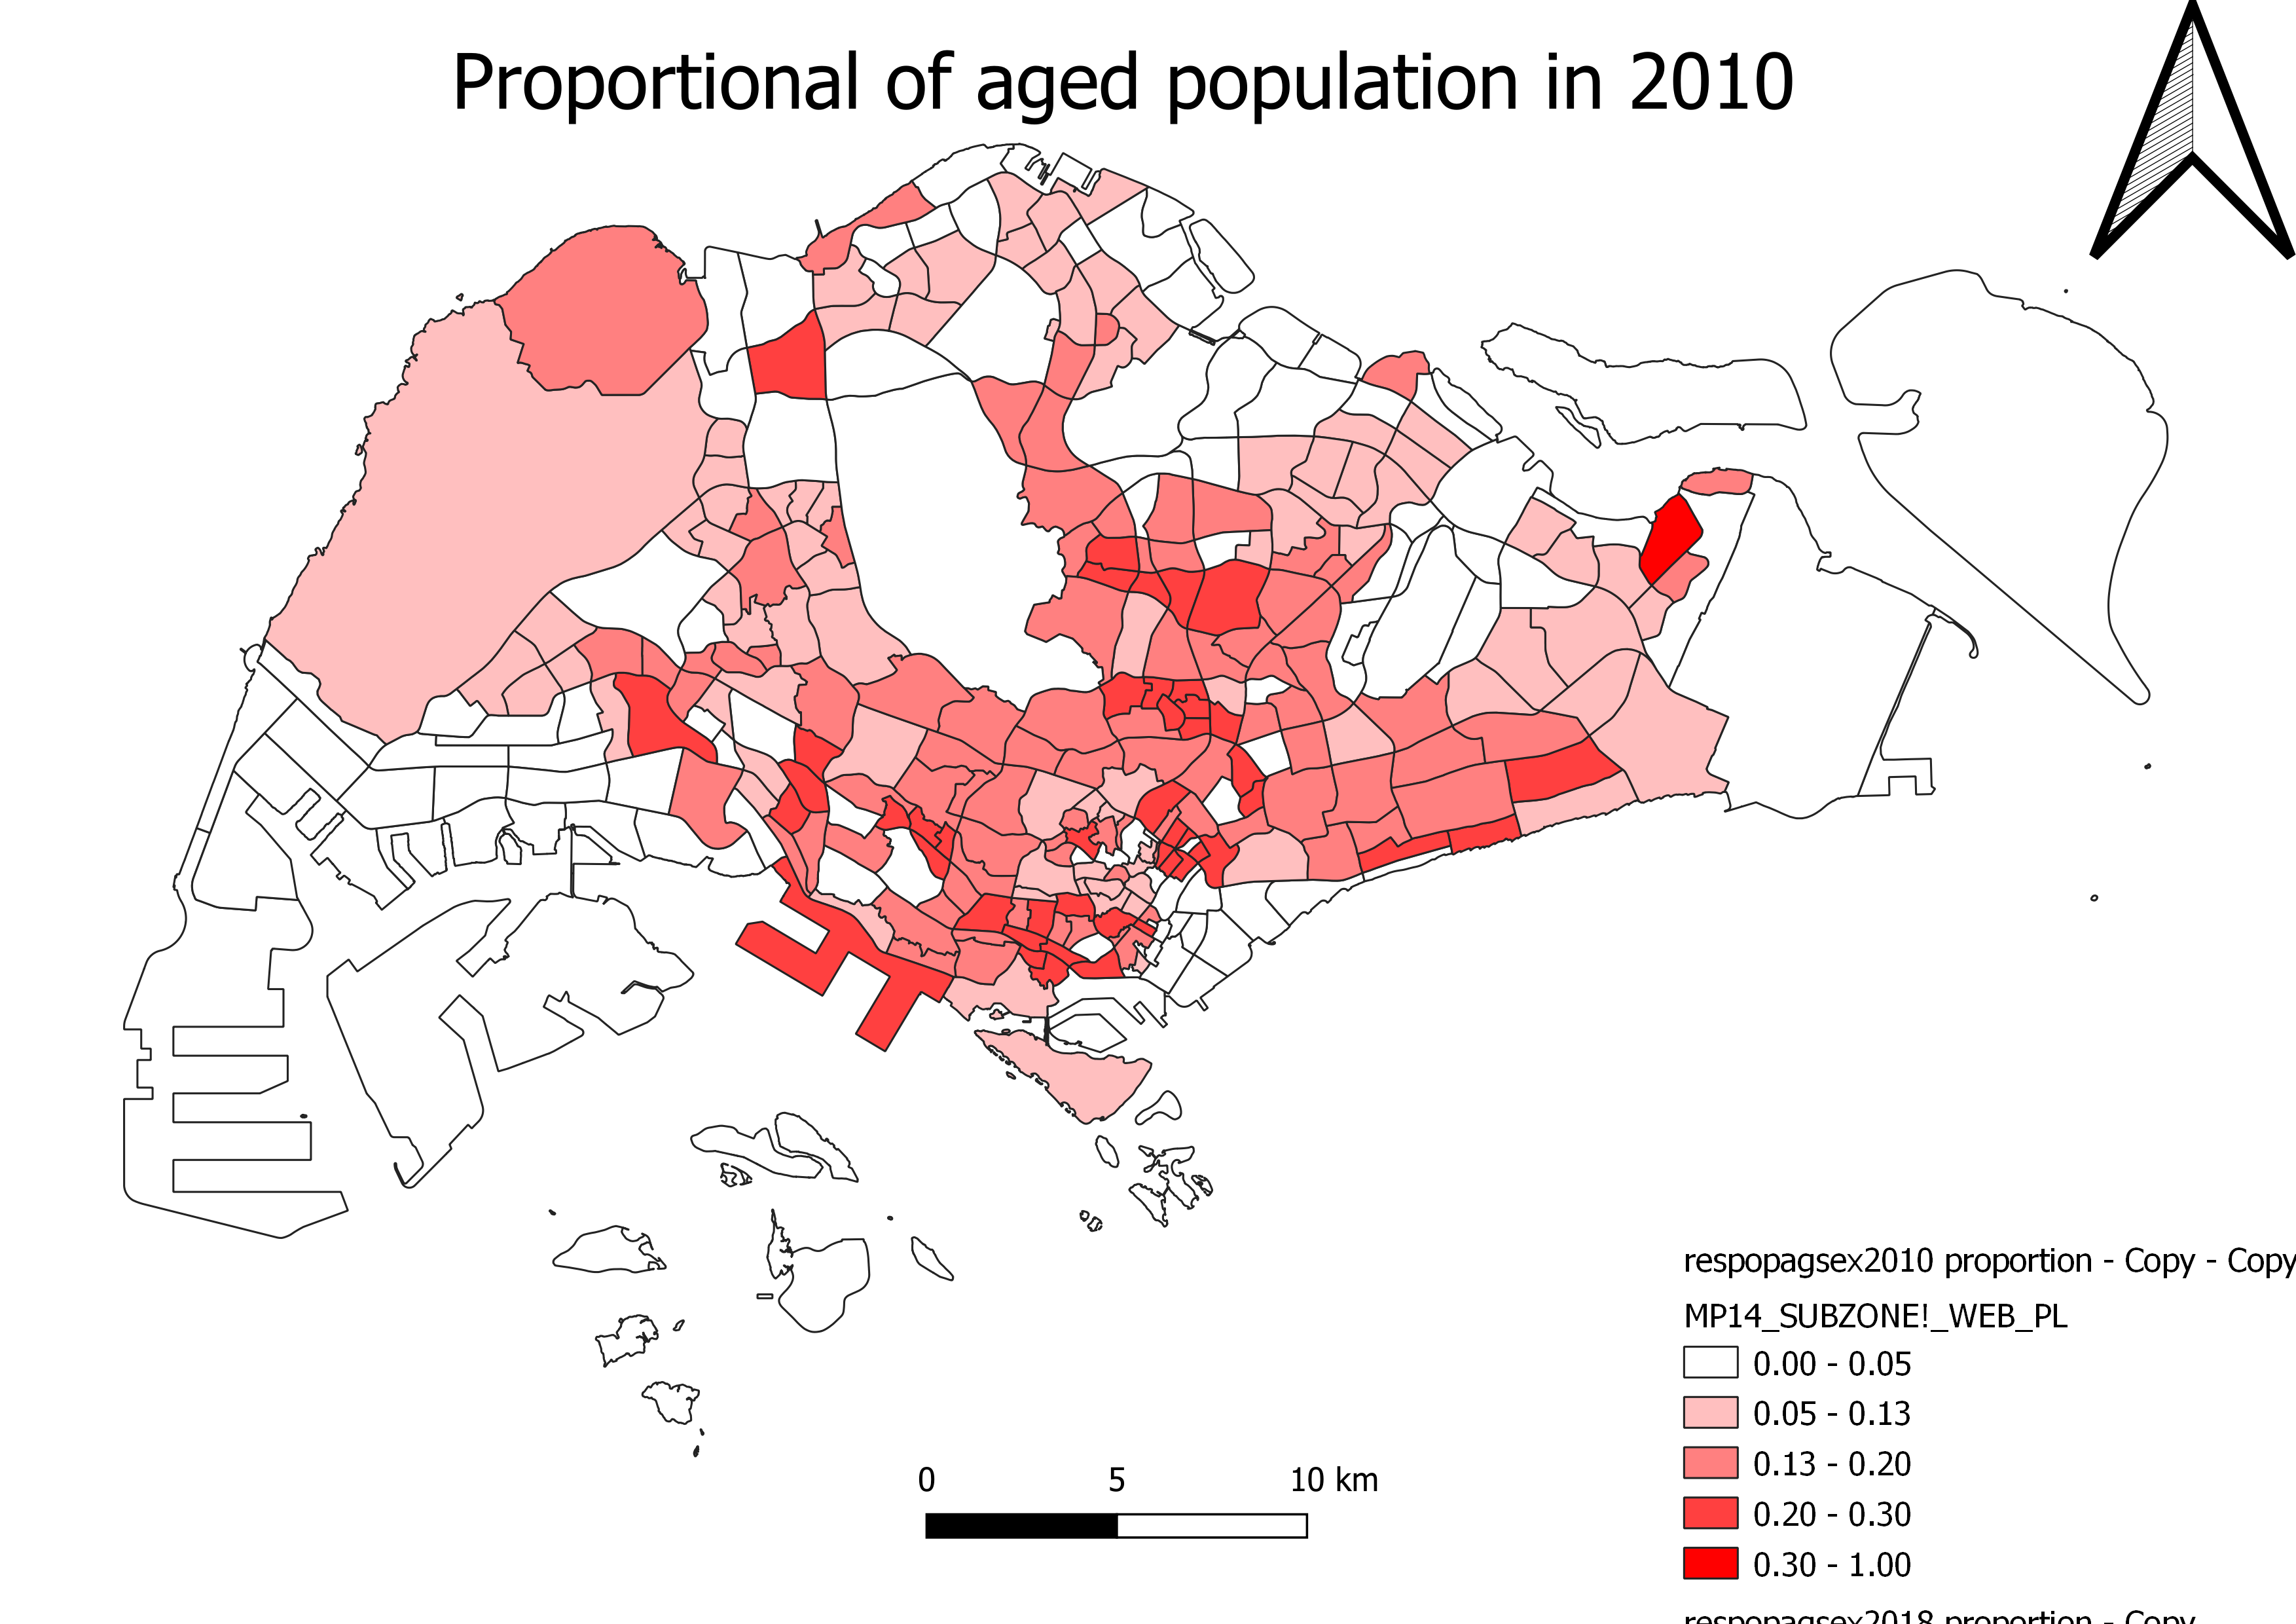
| 16:32, 15 September 2019 | Population 2010.png (file) |  |
735 KB | Vanessa.au.2018 | This map shows the distribution of the population aged 65 years old and above in 2010. The varying intensity of colours indicate the number of people aged 65+ in each planning subzone. Darker intensity highlights that the planning area has a higher num... | 1 |
| 16:35, 15 September 2019 | Photo6334574753393781277.jpg (file) |  |
352 KB | Sqseah.2018 | 1 | |
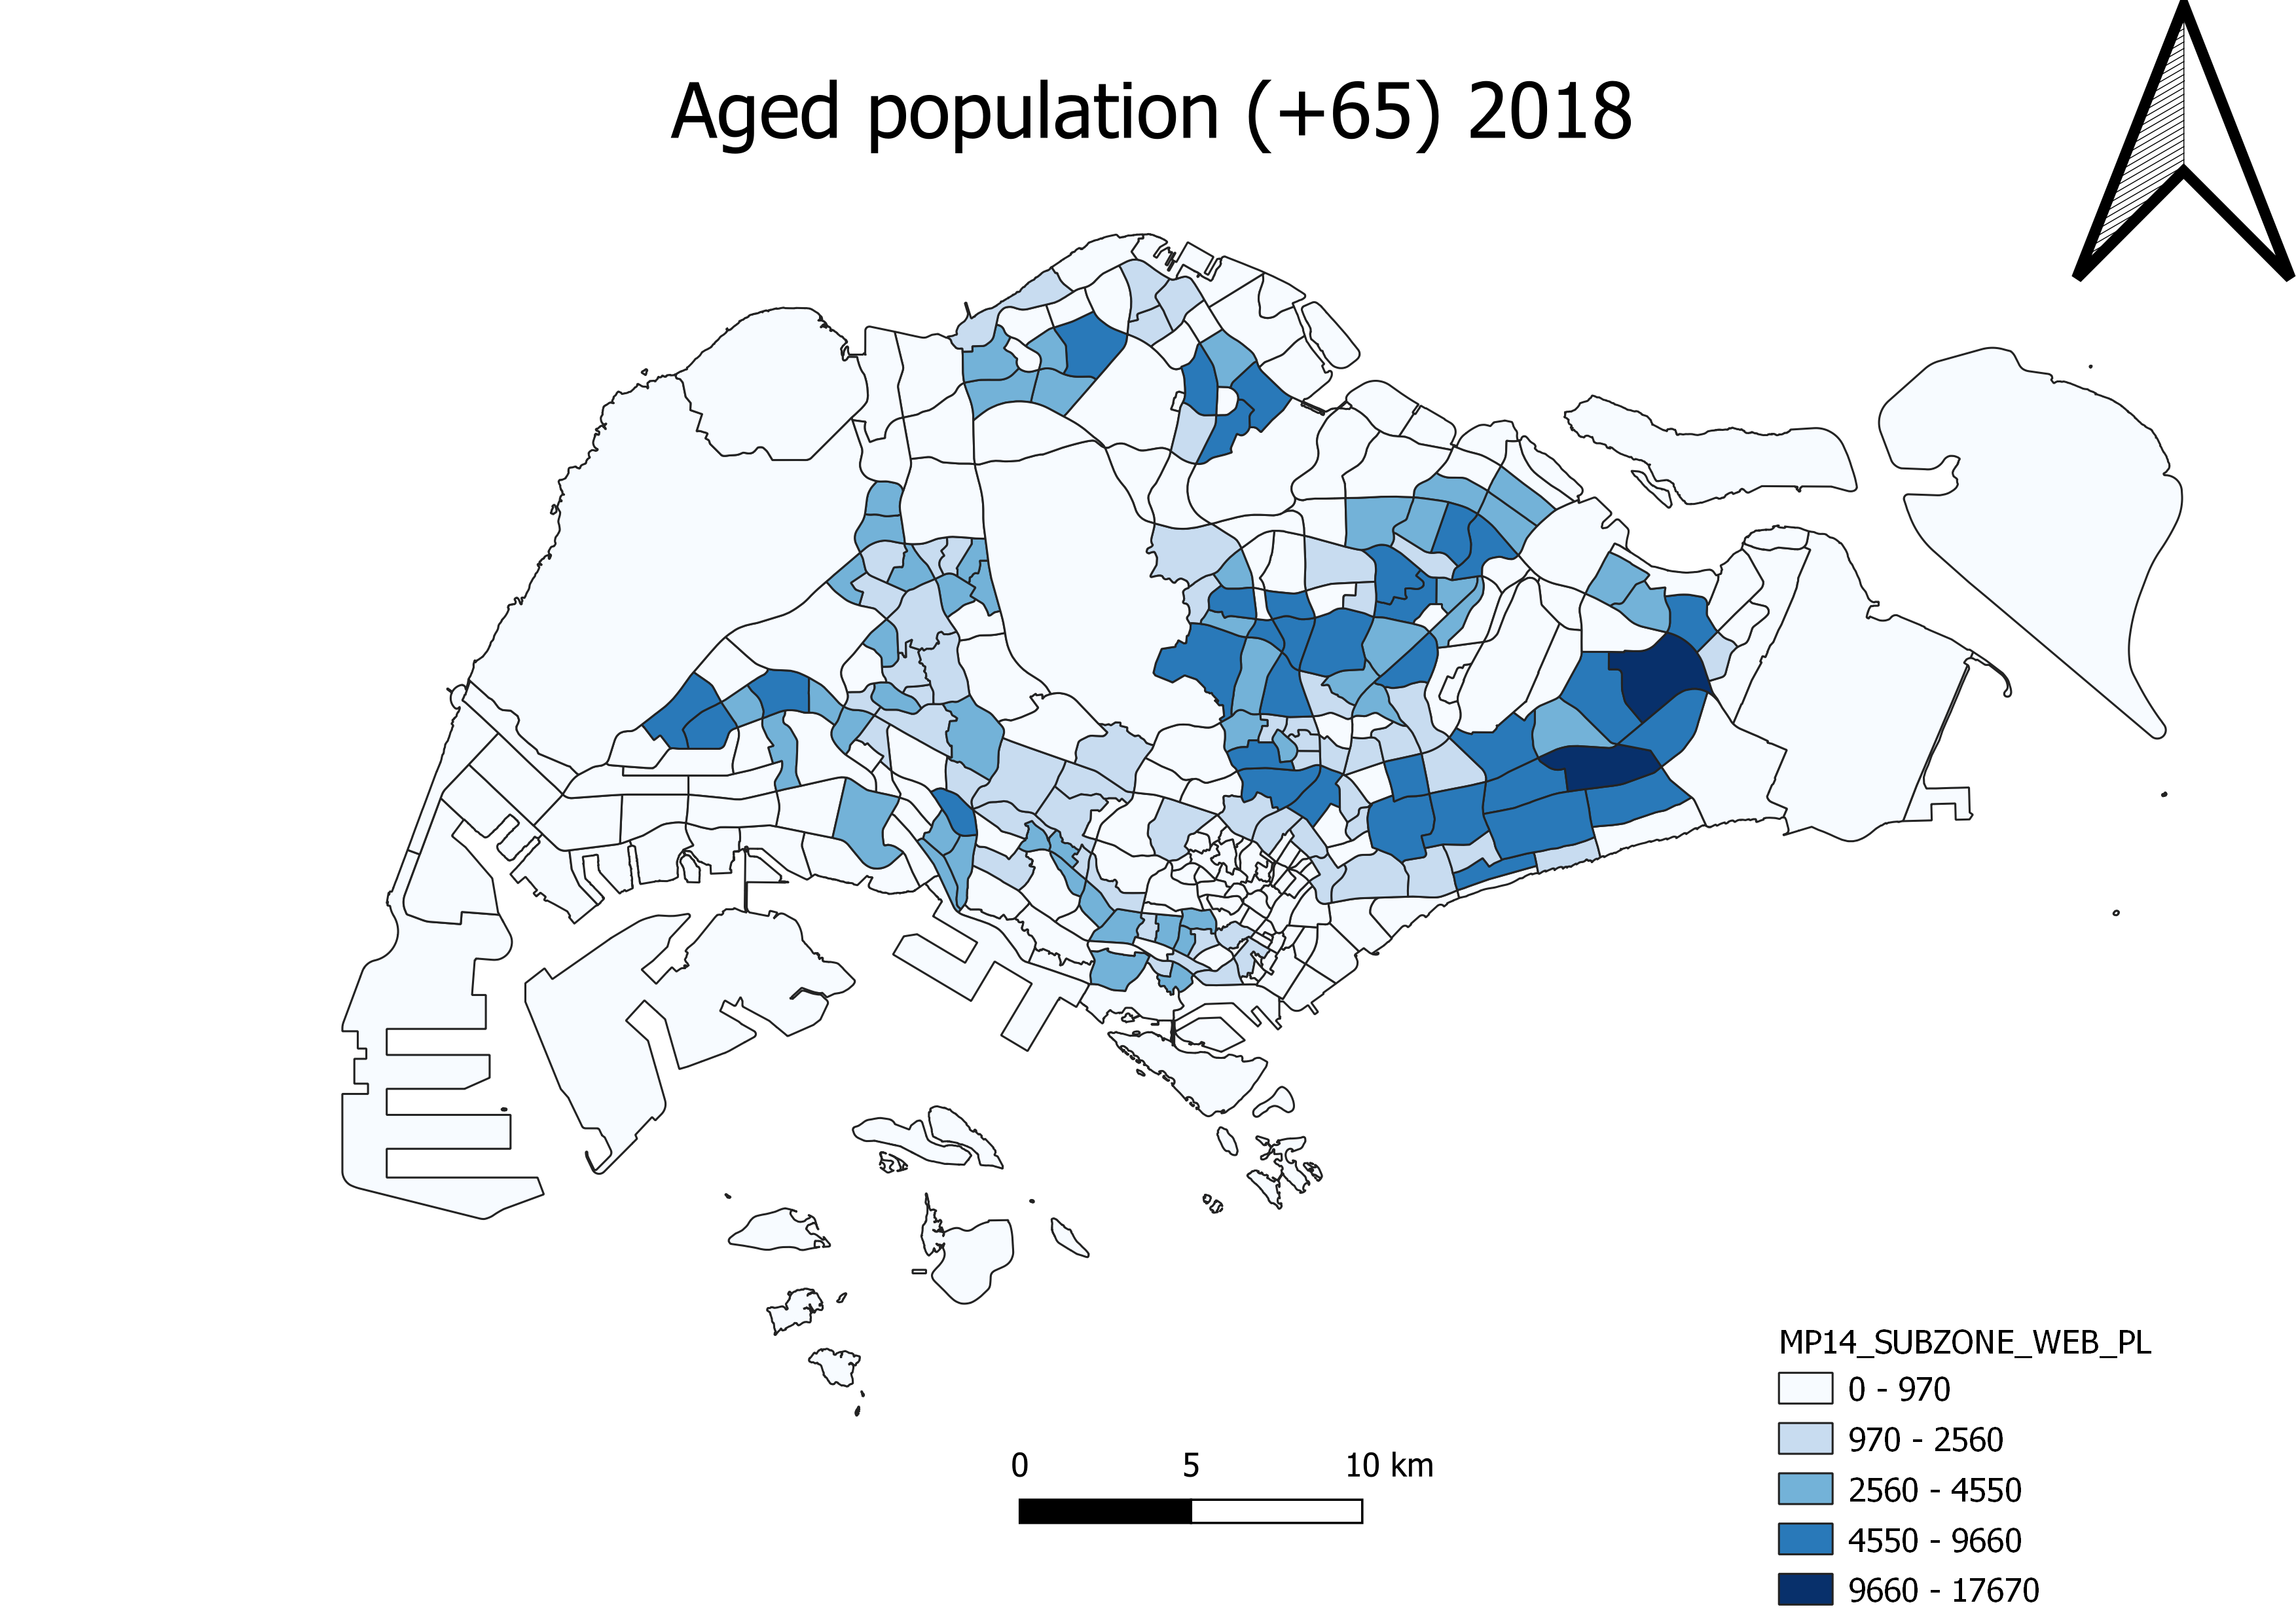
| 16:37, 15 September 2019 | Population 2018.png (file) |  |
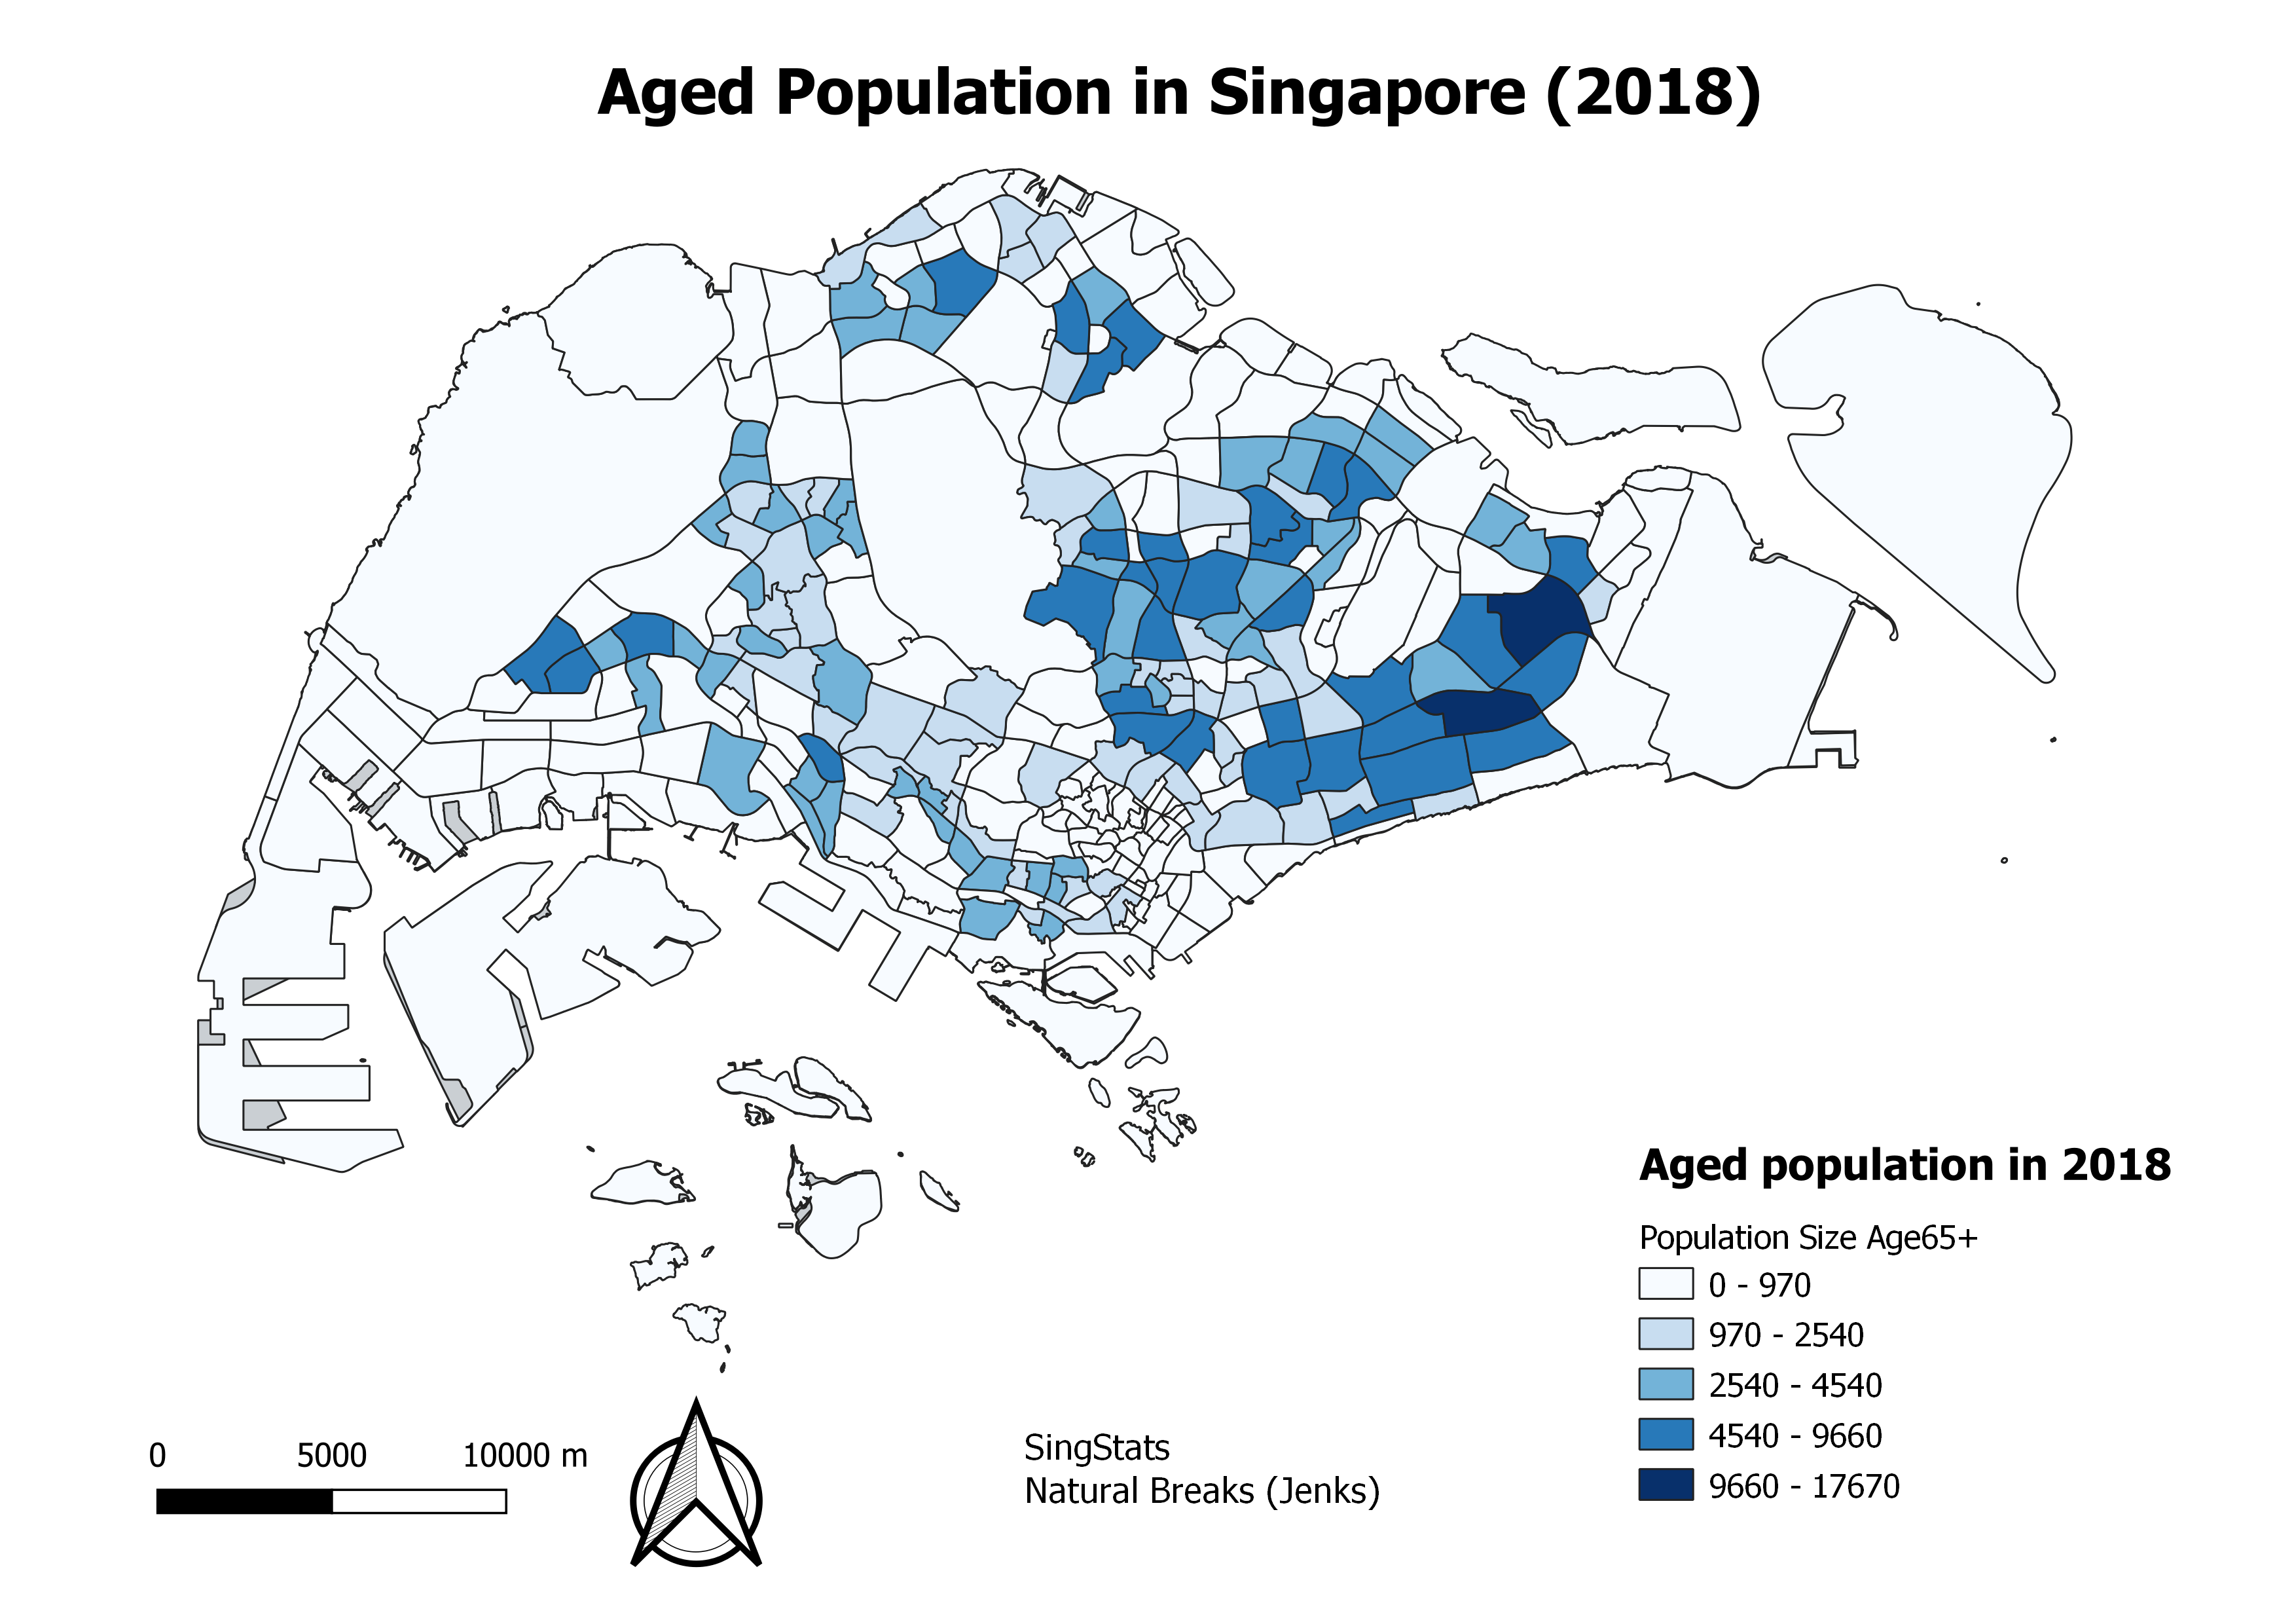
707 KB | Vanessa.au.2018 | This map shows the distribution of the population aged 65 years old and above in 2018. The varying intensity of colours indicate the number of people aged 65+ in each planning subzone. Darker intensity highlights that the planning subzone has a higher... | 1 |