File:Population 2010.png
Jump to navigation
Jump to search

Size of this preview: 800 × 565 pixels. Other resolutions: 320 × 226 pixels | 2,923 × 2,066 pixels.
Original file (2,923 × 2,066 pixels, file size: 735 KB, MIME type: image/png)
Summary
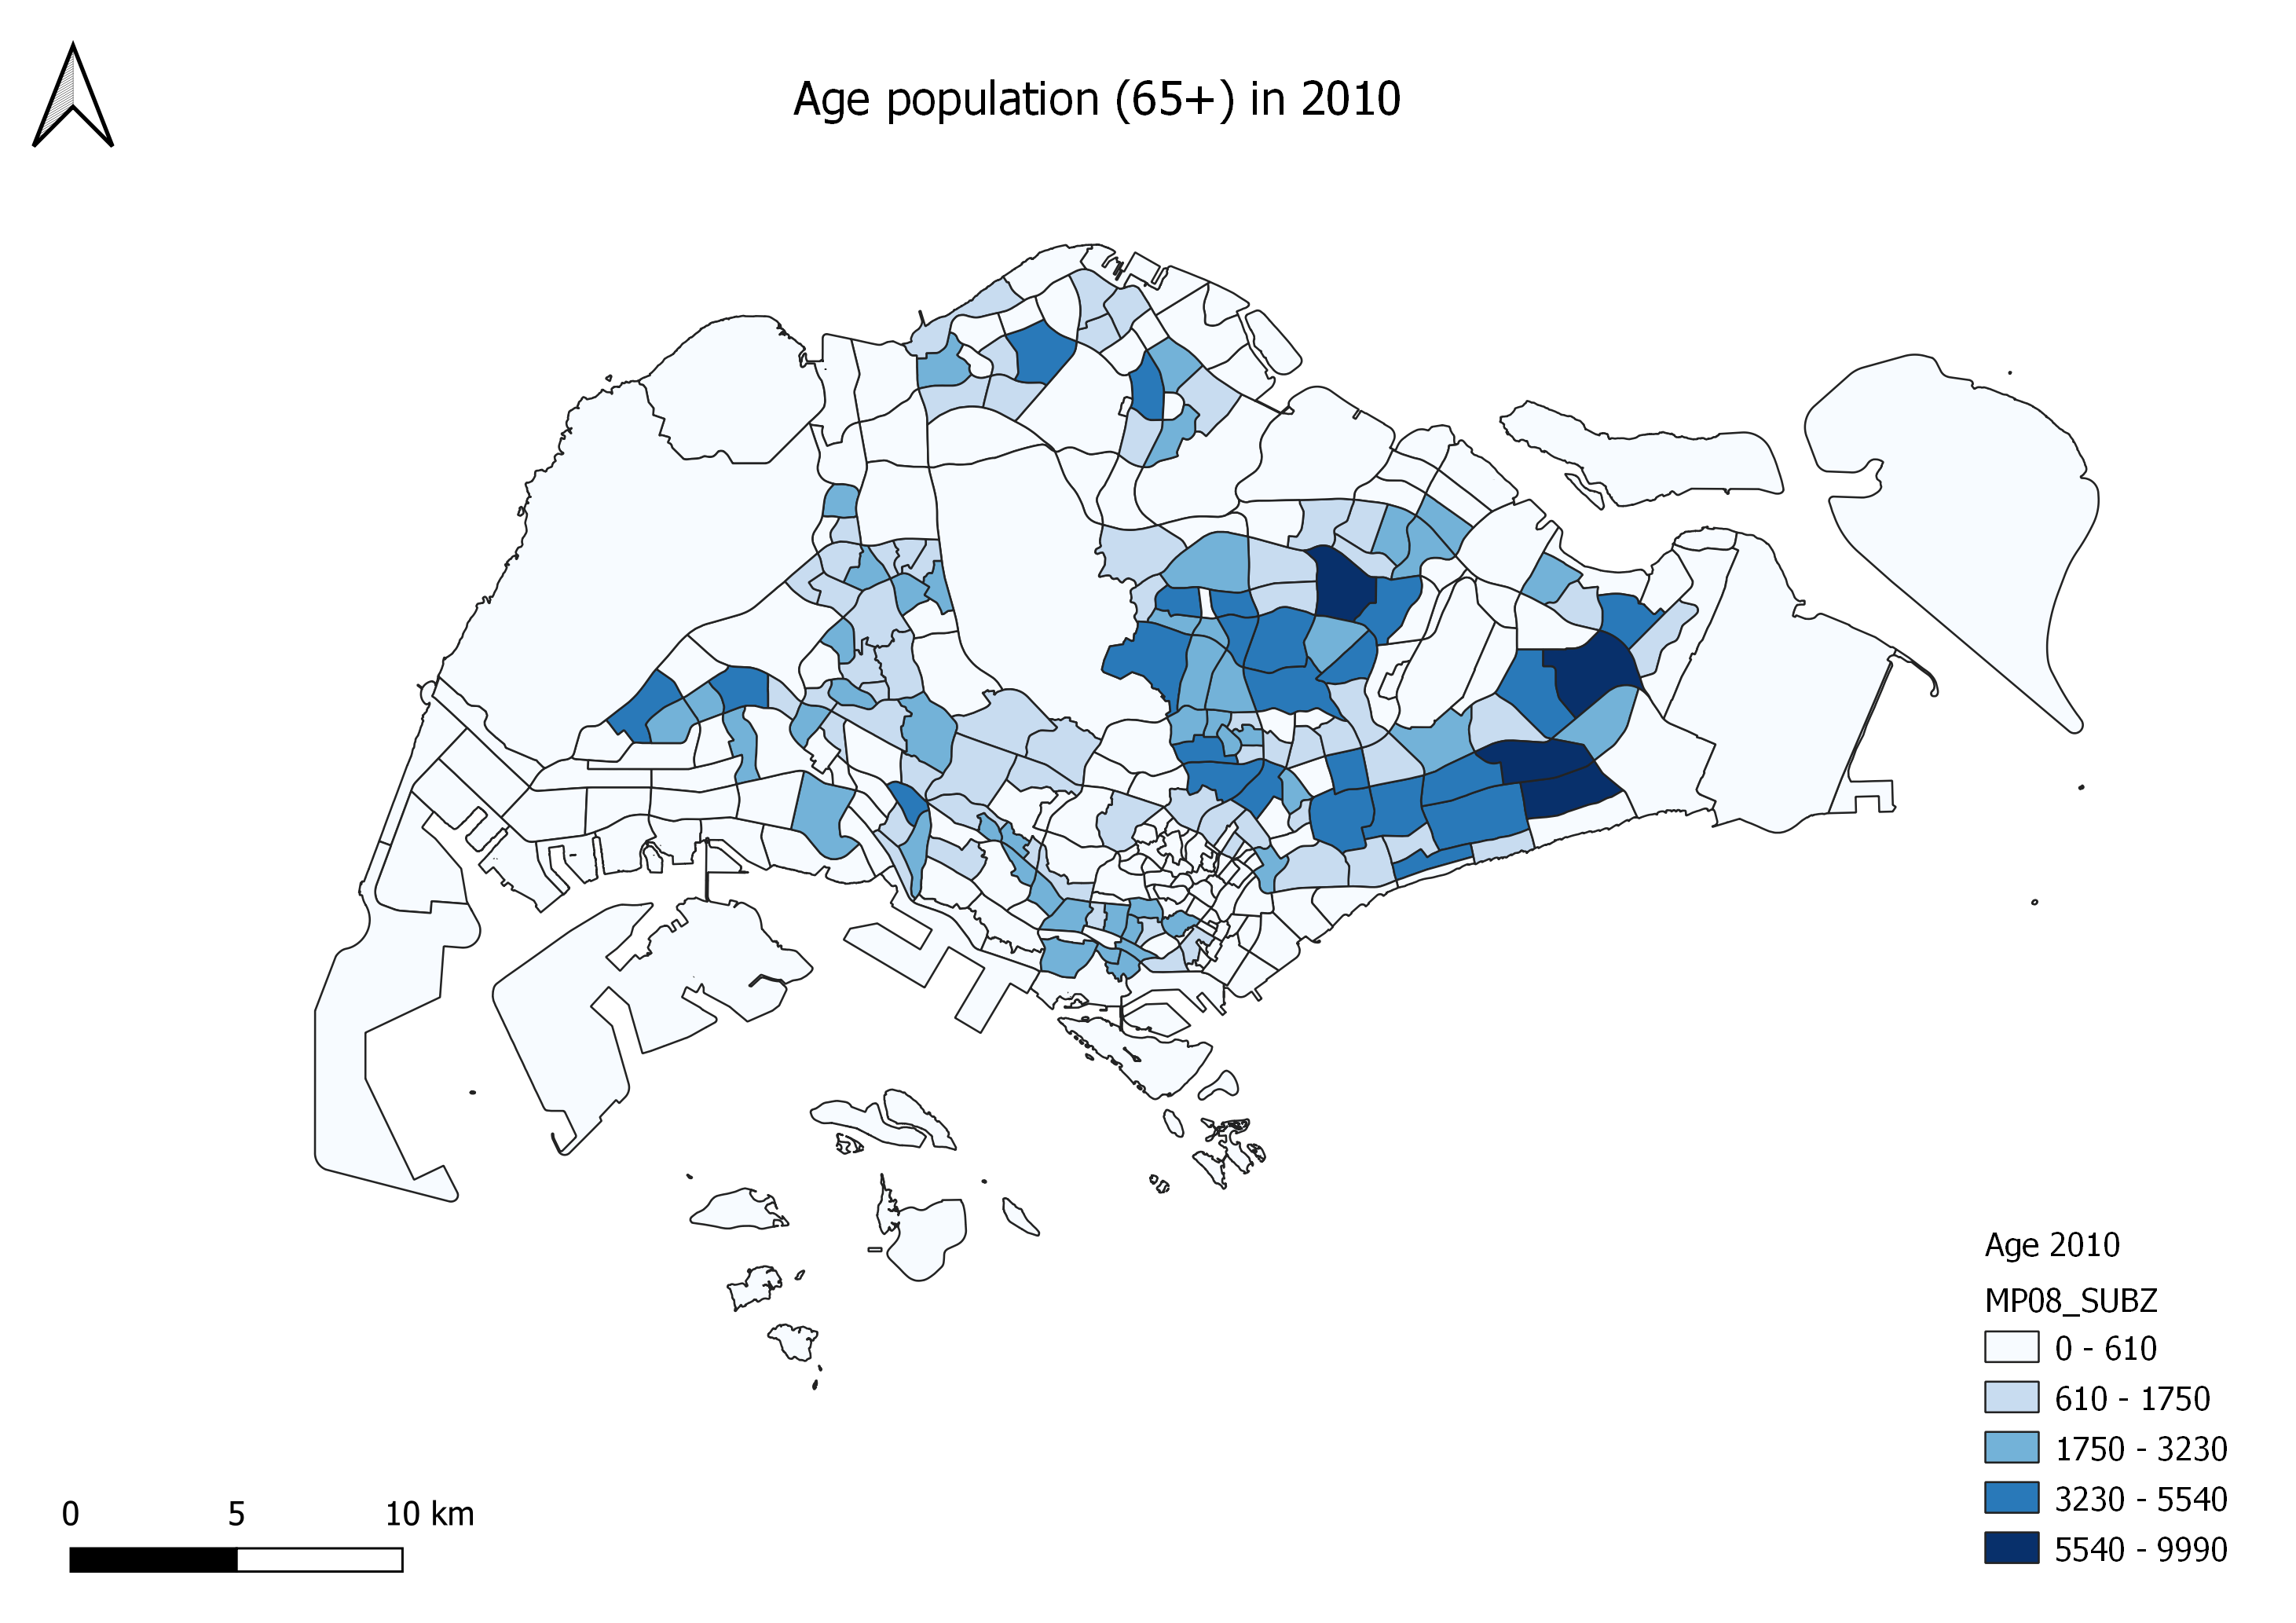
This map shows the distribution of the population aged 65 years old and above in 2010. The varying intensity of colours indicate the number of people aged 65+ in each planning subzone. Darker intensity highlights that the planning area has a higher number of people aged 65 and above.
File history
Click on a date/time to view the file as it appeared at that time.
| Date/Time | Thumbnail | Dimensions | User | Comment | |
|---|---|---|---|---|---|
| current | 16:32, 15 September 2019 | | 2,923 × 2,066 (735 KB) | Vanessa.au.2018 (talk | contribs) | This map shows the distribution of the population aged 65 years old and above in 2010. The varying intensity of colours indicate the number of people aged 65+ in each planning subzone. Darker intensity highlights that the planning area has a higher num... |
- You cannot overwrite this file.
File usage
The following file is a duplicate of this file (more details):
There are no pages that use this file.