IS428-AY2019-20T1 Climate Vizards: Proposal - Others
Jump to navigation
Jump to search


Climate Vizards
|
|
|
|
|
|
|
|
|
|
|
|
|
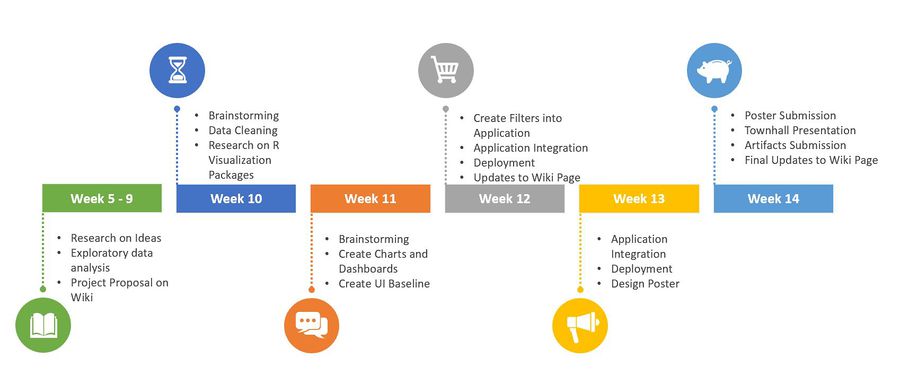
Timeline

Challenges
| Challenges | Proposed solution |
|---|---|
| Understanding deeper levels of data visualisations to provide users with better insights on climate changes |
Research more on different types of R packages |
| Creating interactive storyboards that can provide a holistic overview of the cause-and-effect of climate conditions. For example, being able to filter and zoom on-demand. | Continuous prototyping of the ideal dashboard |
| Using R and Rshiny to design the desired plots as close as we can to the ideal storyboard | Diligently complete the lessons in datacamp to understand how different attributes in different R packages function |
| Building complex visualisation such as spatial interpolation | Read up early and start trying at an earlier stage of the project as it will require time |
| Getting Singapore's temperature and rainfall data | Diligently download the data by month and location |